

Heatmap
Heatmap Module
The Entire Market, One View
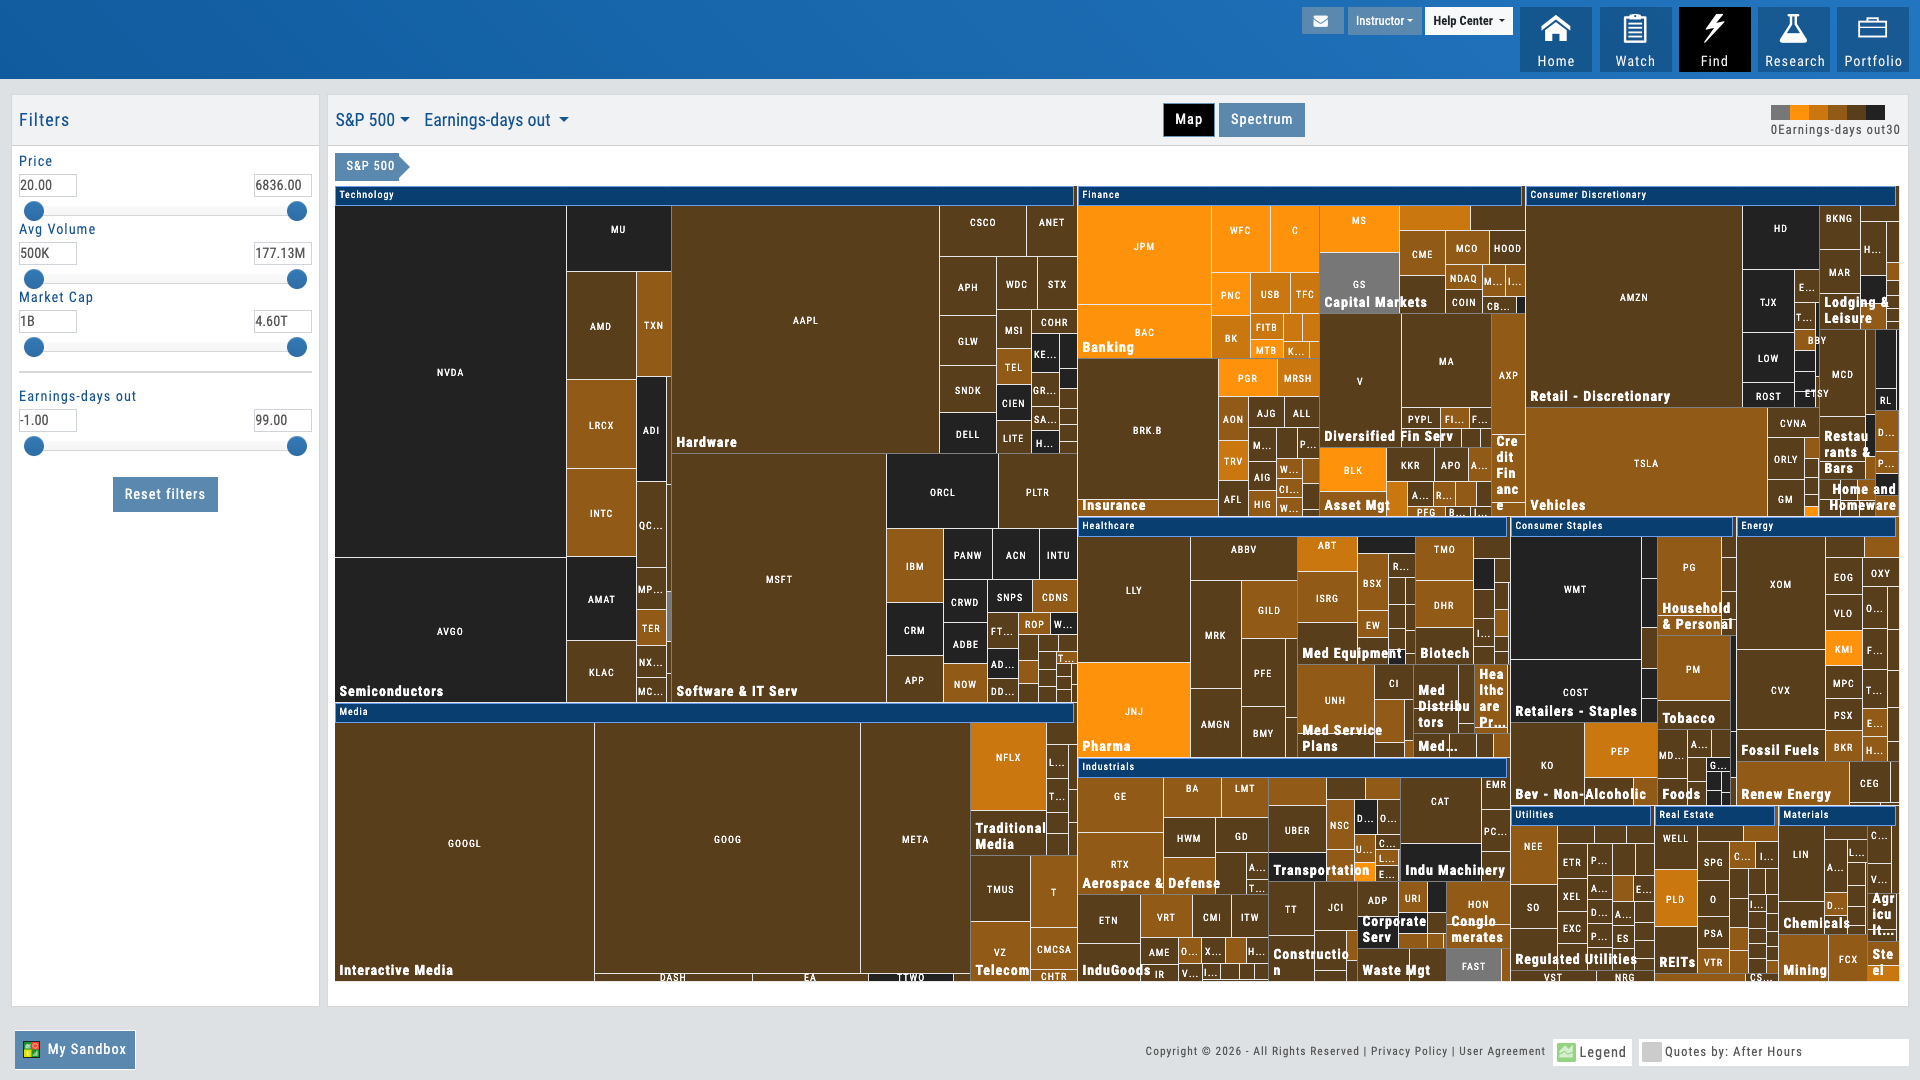
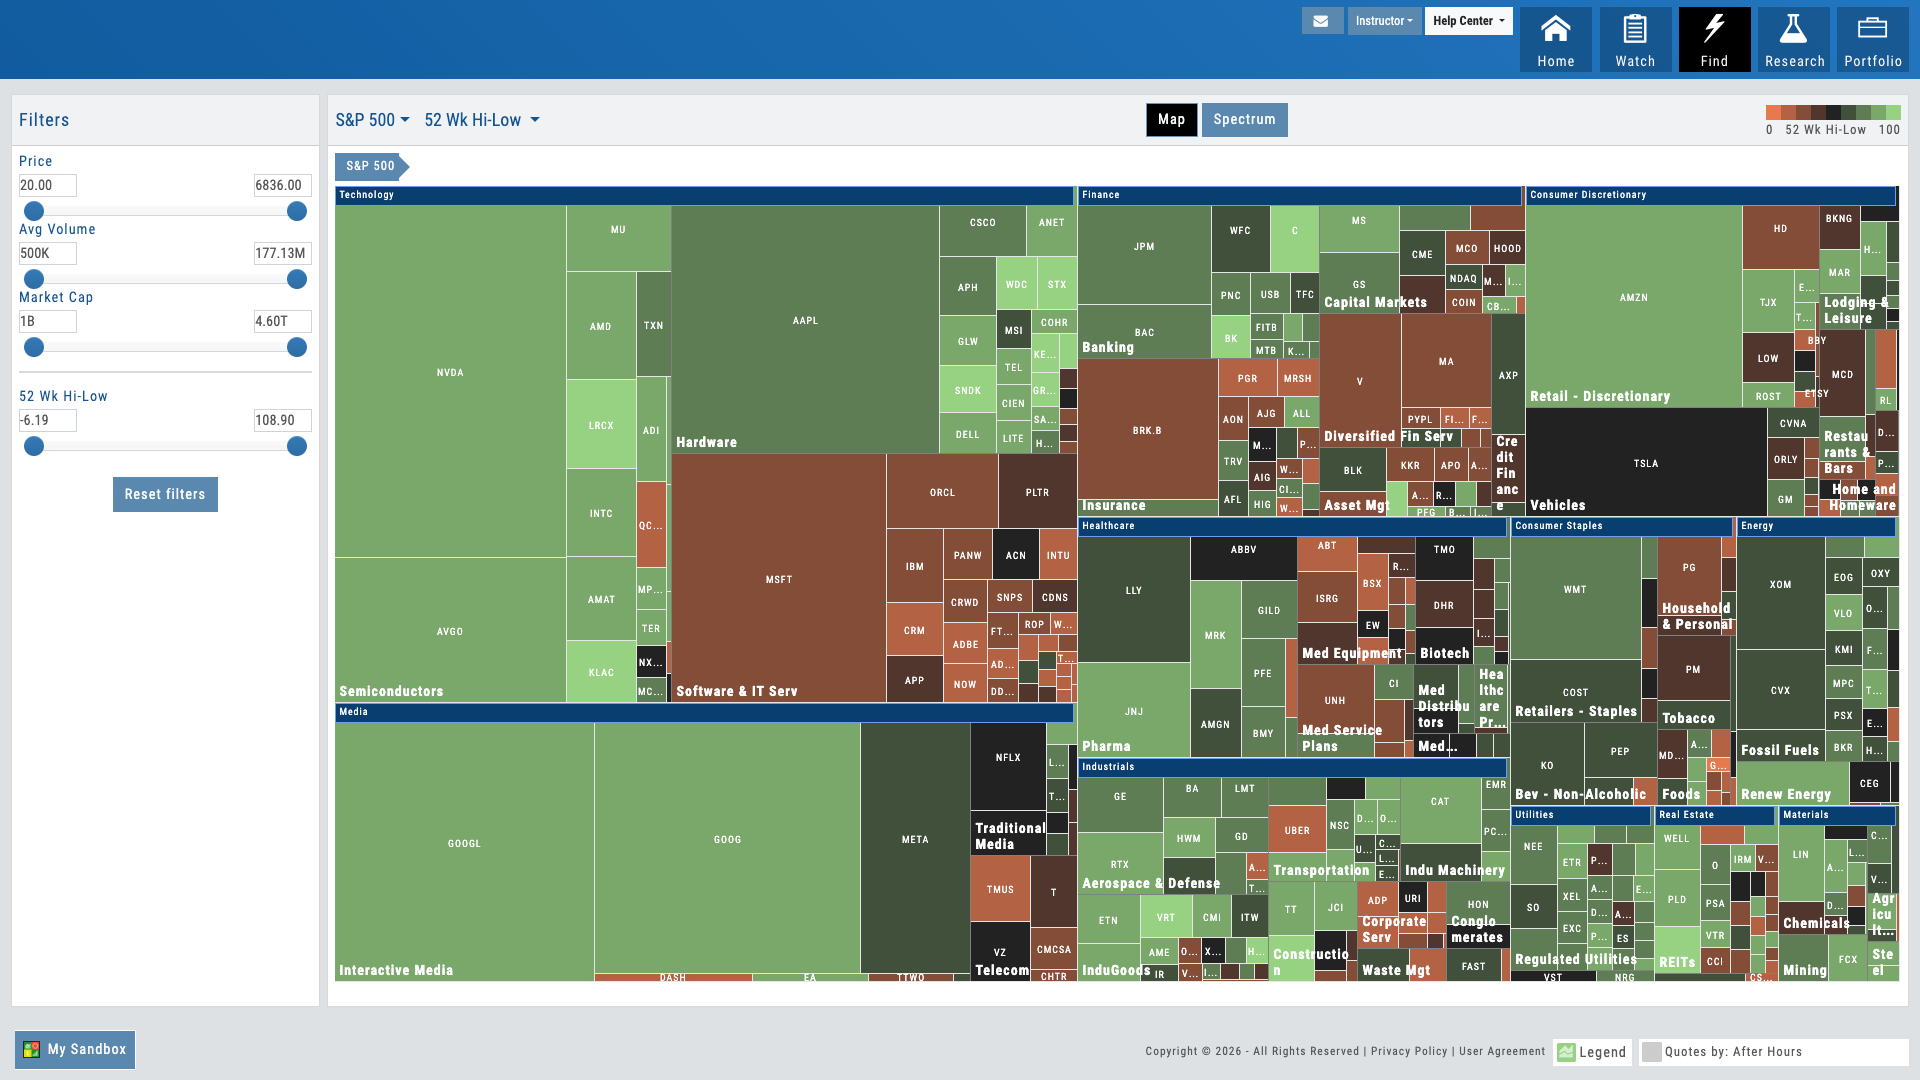
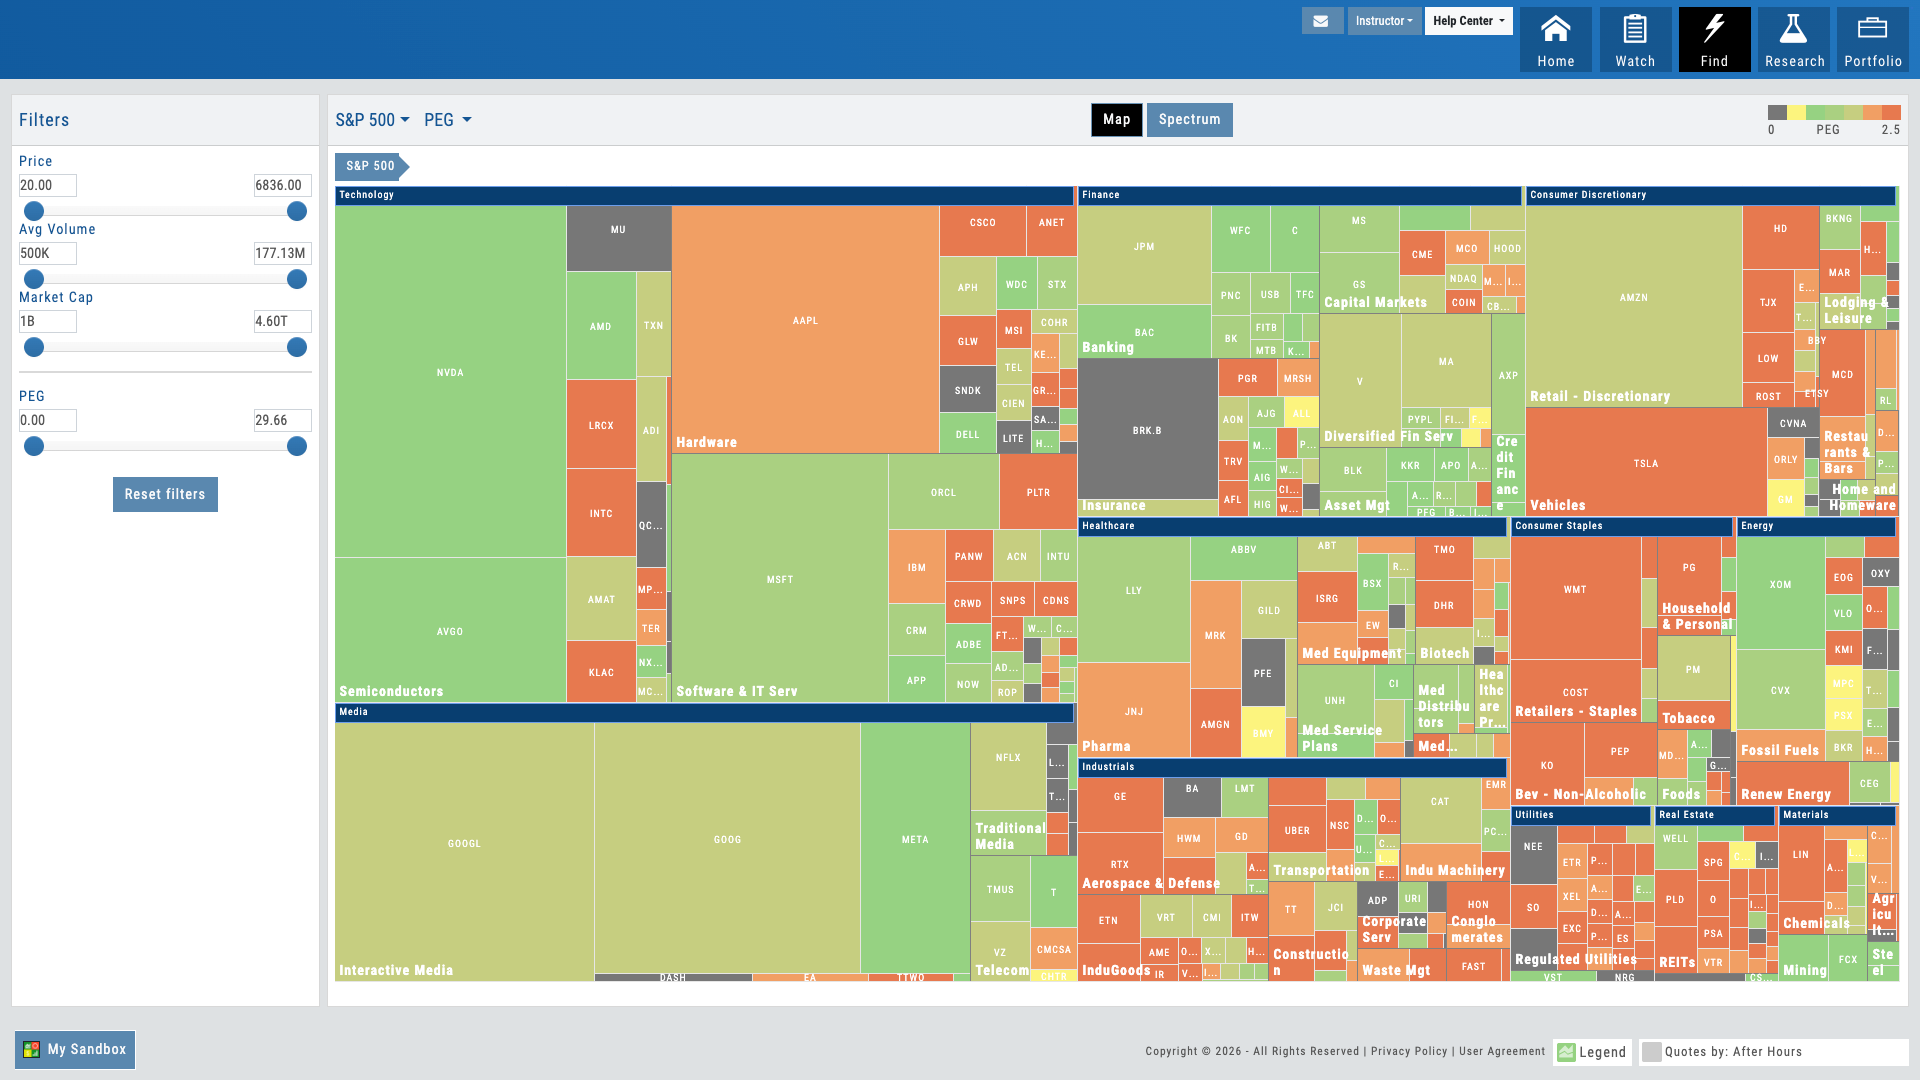
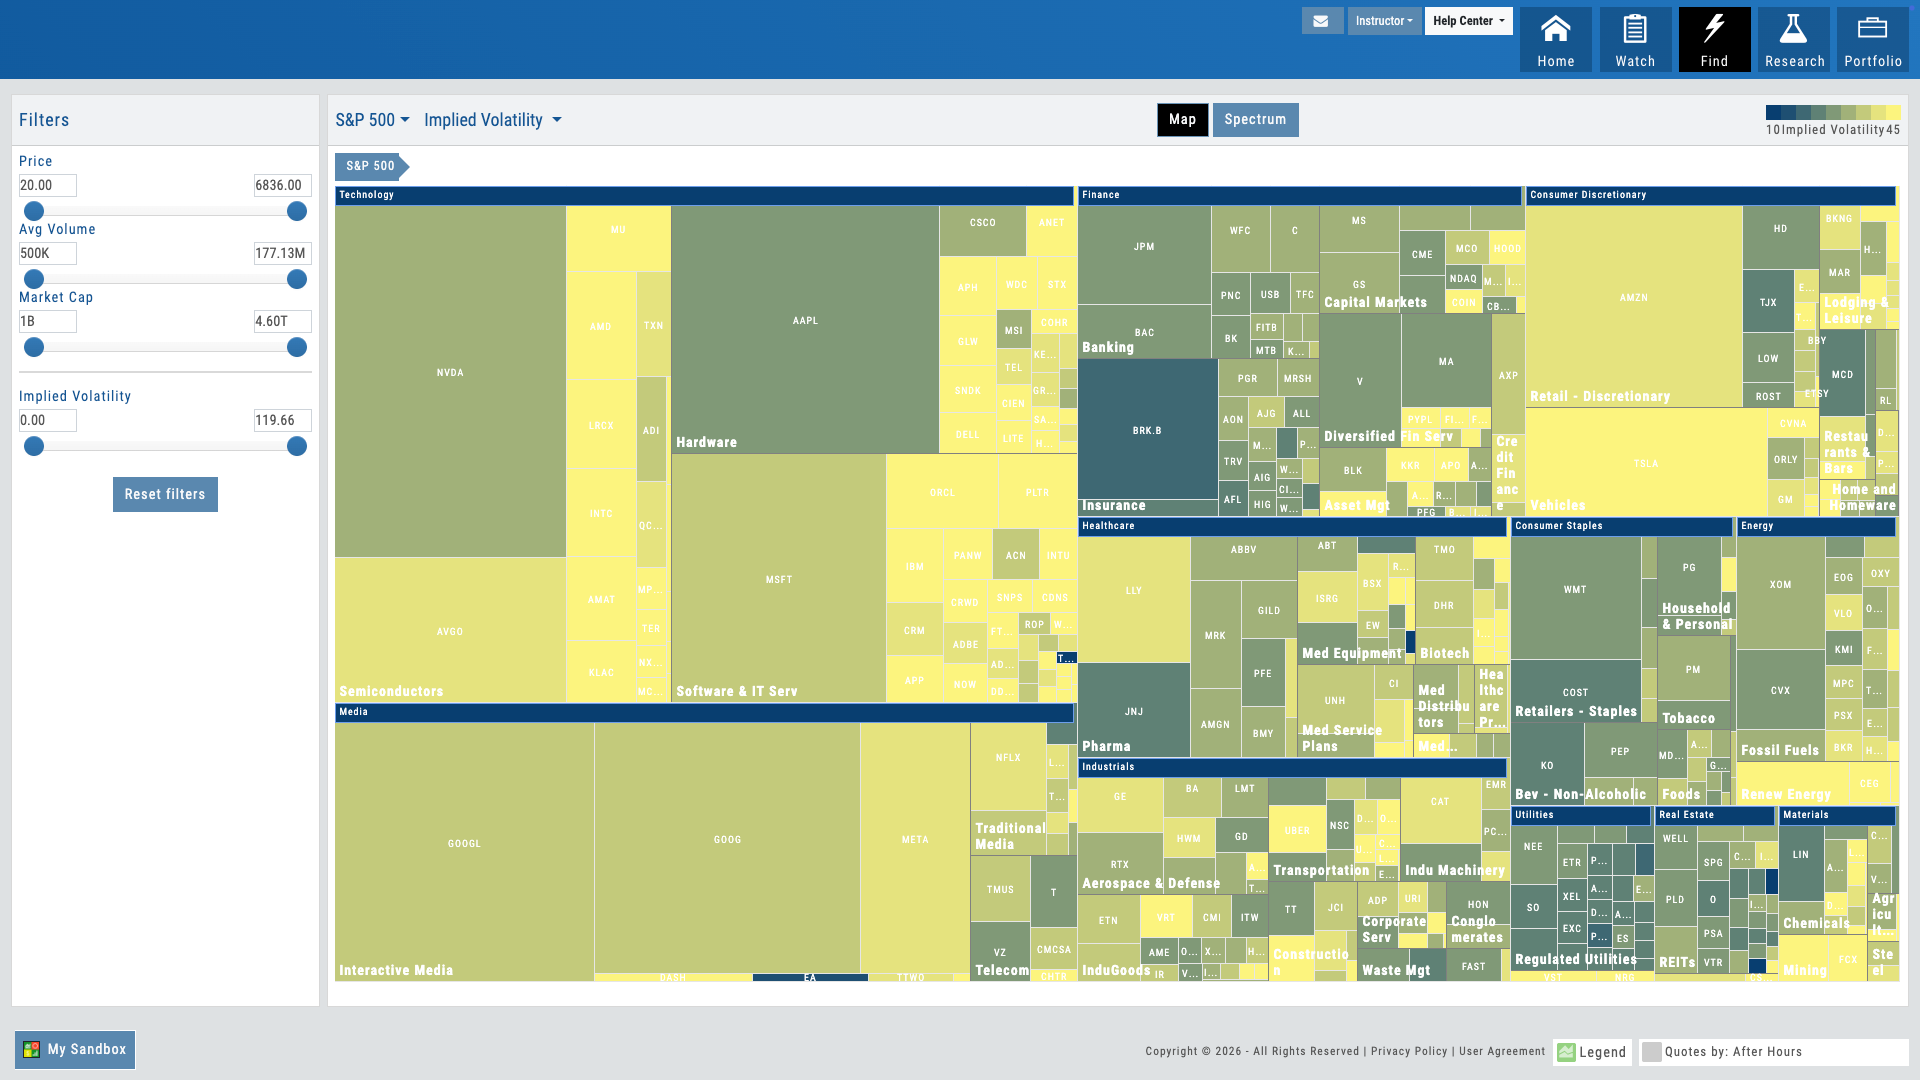
S&P sectors color-coded by performance. Drill from index to sector to industry to stock in one click. Size represents market cap. Multiple timeframes: 1D, 1W, 1M, 3M, YTD, 1Y. The perfect starting point for market discussion — open the heatmap and teach from what’s happening now.
Heatmap Module
Interactive Guide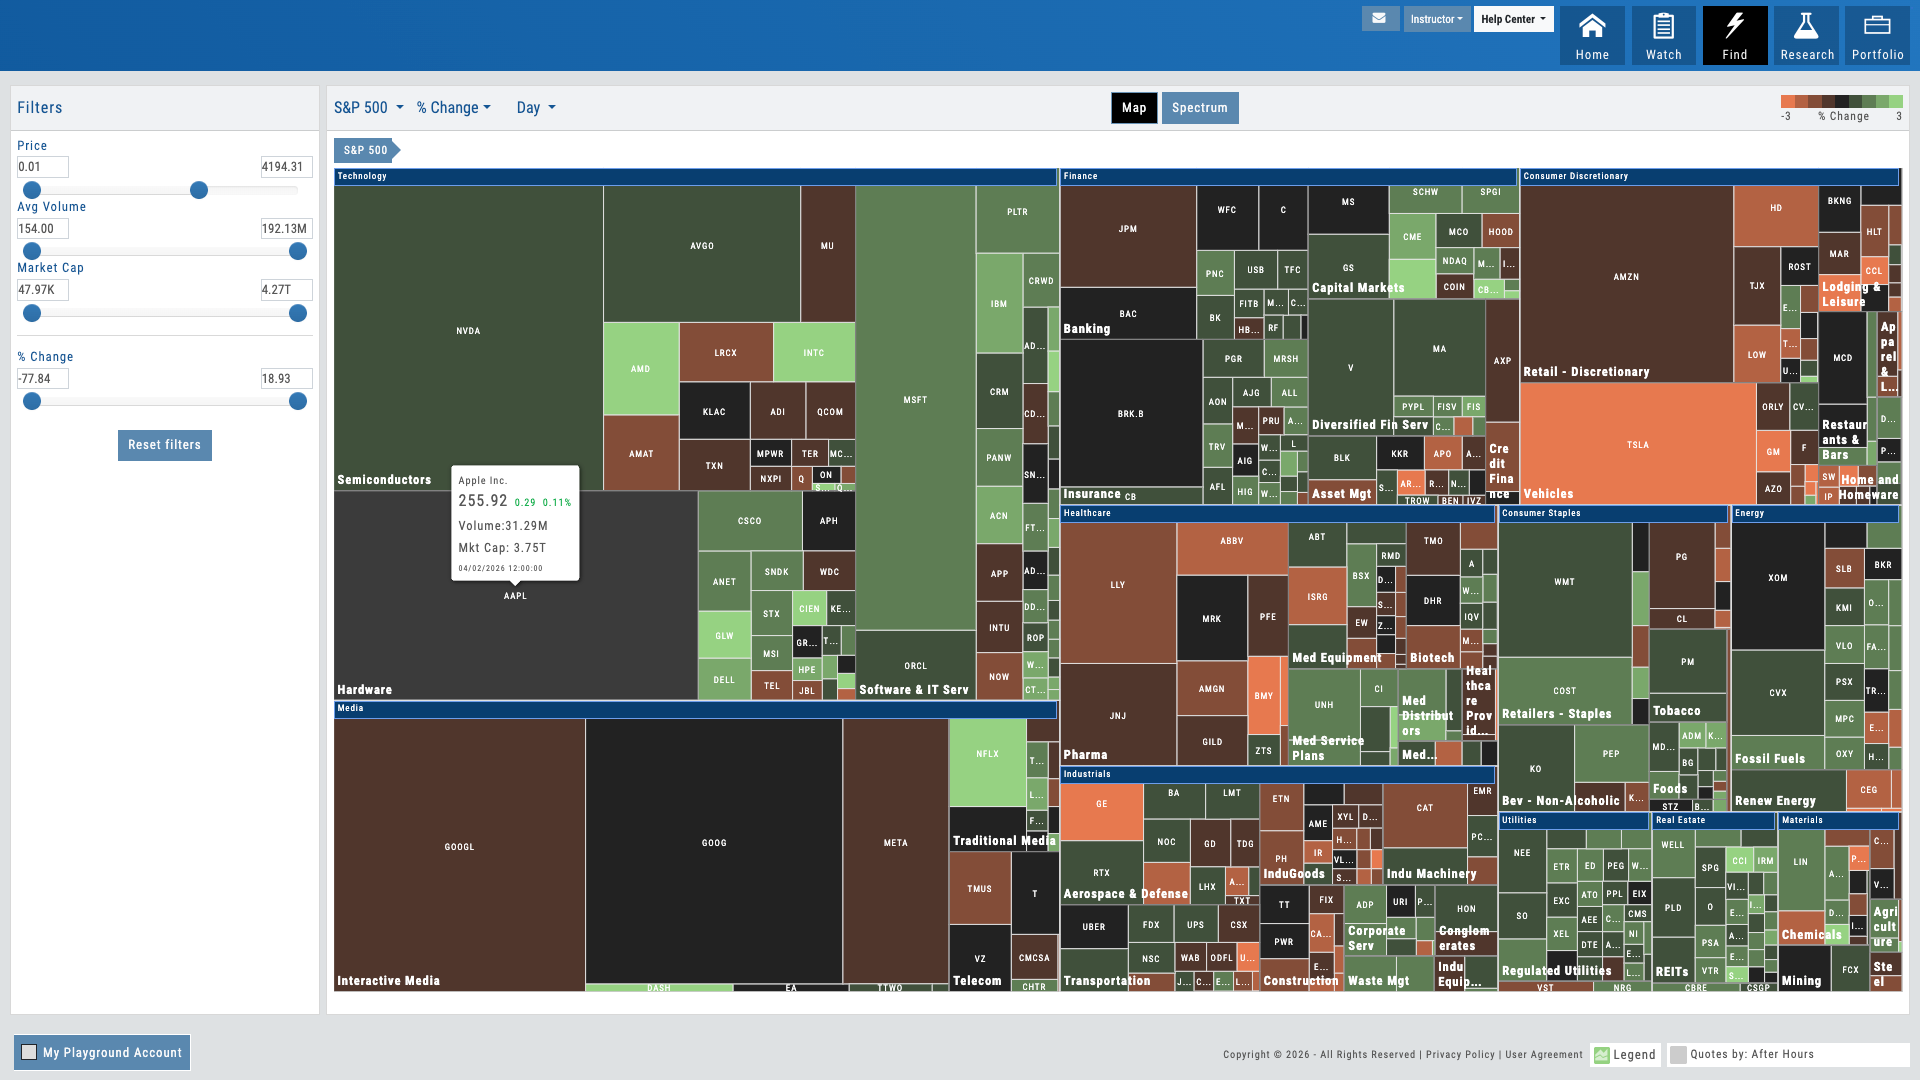
01 — Market Discovery
Drill Down from Market to Stock
Click a sector, see industries. Click an industry, find the stocks driving performance. Size represents market cap, color represents performance.
The heatmap is discovery. Instead of searching for what’s moving, users see the entire market at once — every sector, every industry, every stock — organized by structure and colored by performance. Red to green gradients make winners and losers instant. Market cap determines block size so users see where the volume is.
For educators, this is how market lessons begin. Open the heatmap and ask: “What’s green today and why?” Students drill down, spot patterns across sectors, and develop market intuition. The heatmap transforms passive screen-watching into active market exploration.
Multiple timeframes — 1D, 1W, 1M, 3M, YTD, 1Y — let users zoom out and see seasonal patterns or zoom in and see intraday movers. One click moves from broad market view to a single stock ready for deeper analysis.
- S&P 500 sectors color-coded by performance — red to green gradient
- Drill down: sector → industry → individual stocks
- Block size represents market cap — see where the volume is at a glance
- 6 timeframes: 1D, 1W, 1M, 3M, YTD, 1Y — spot intraday moves or seasonal patterns
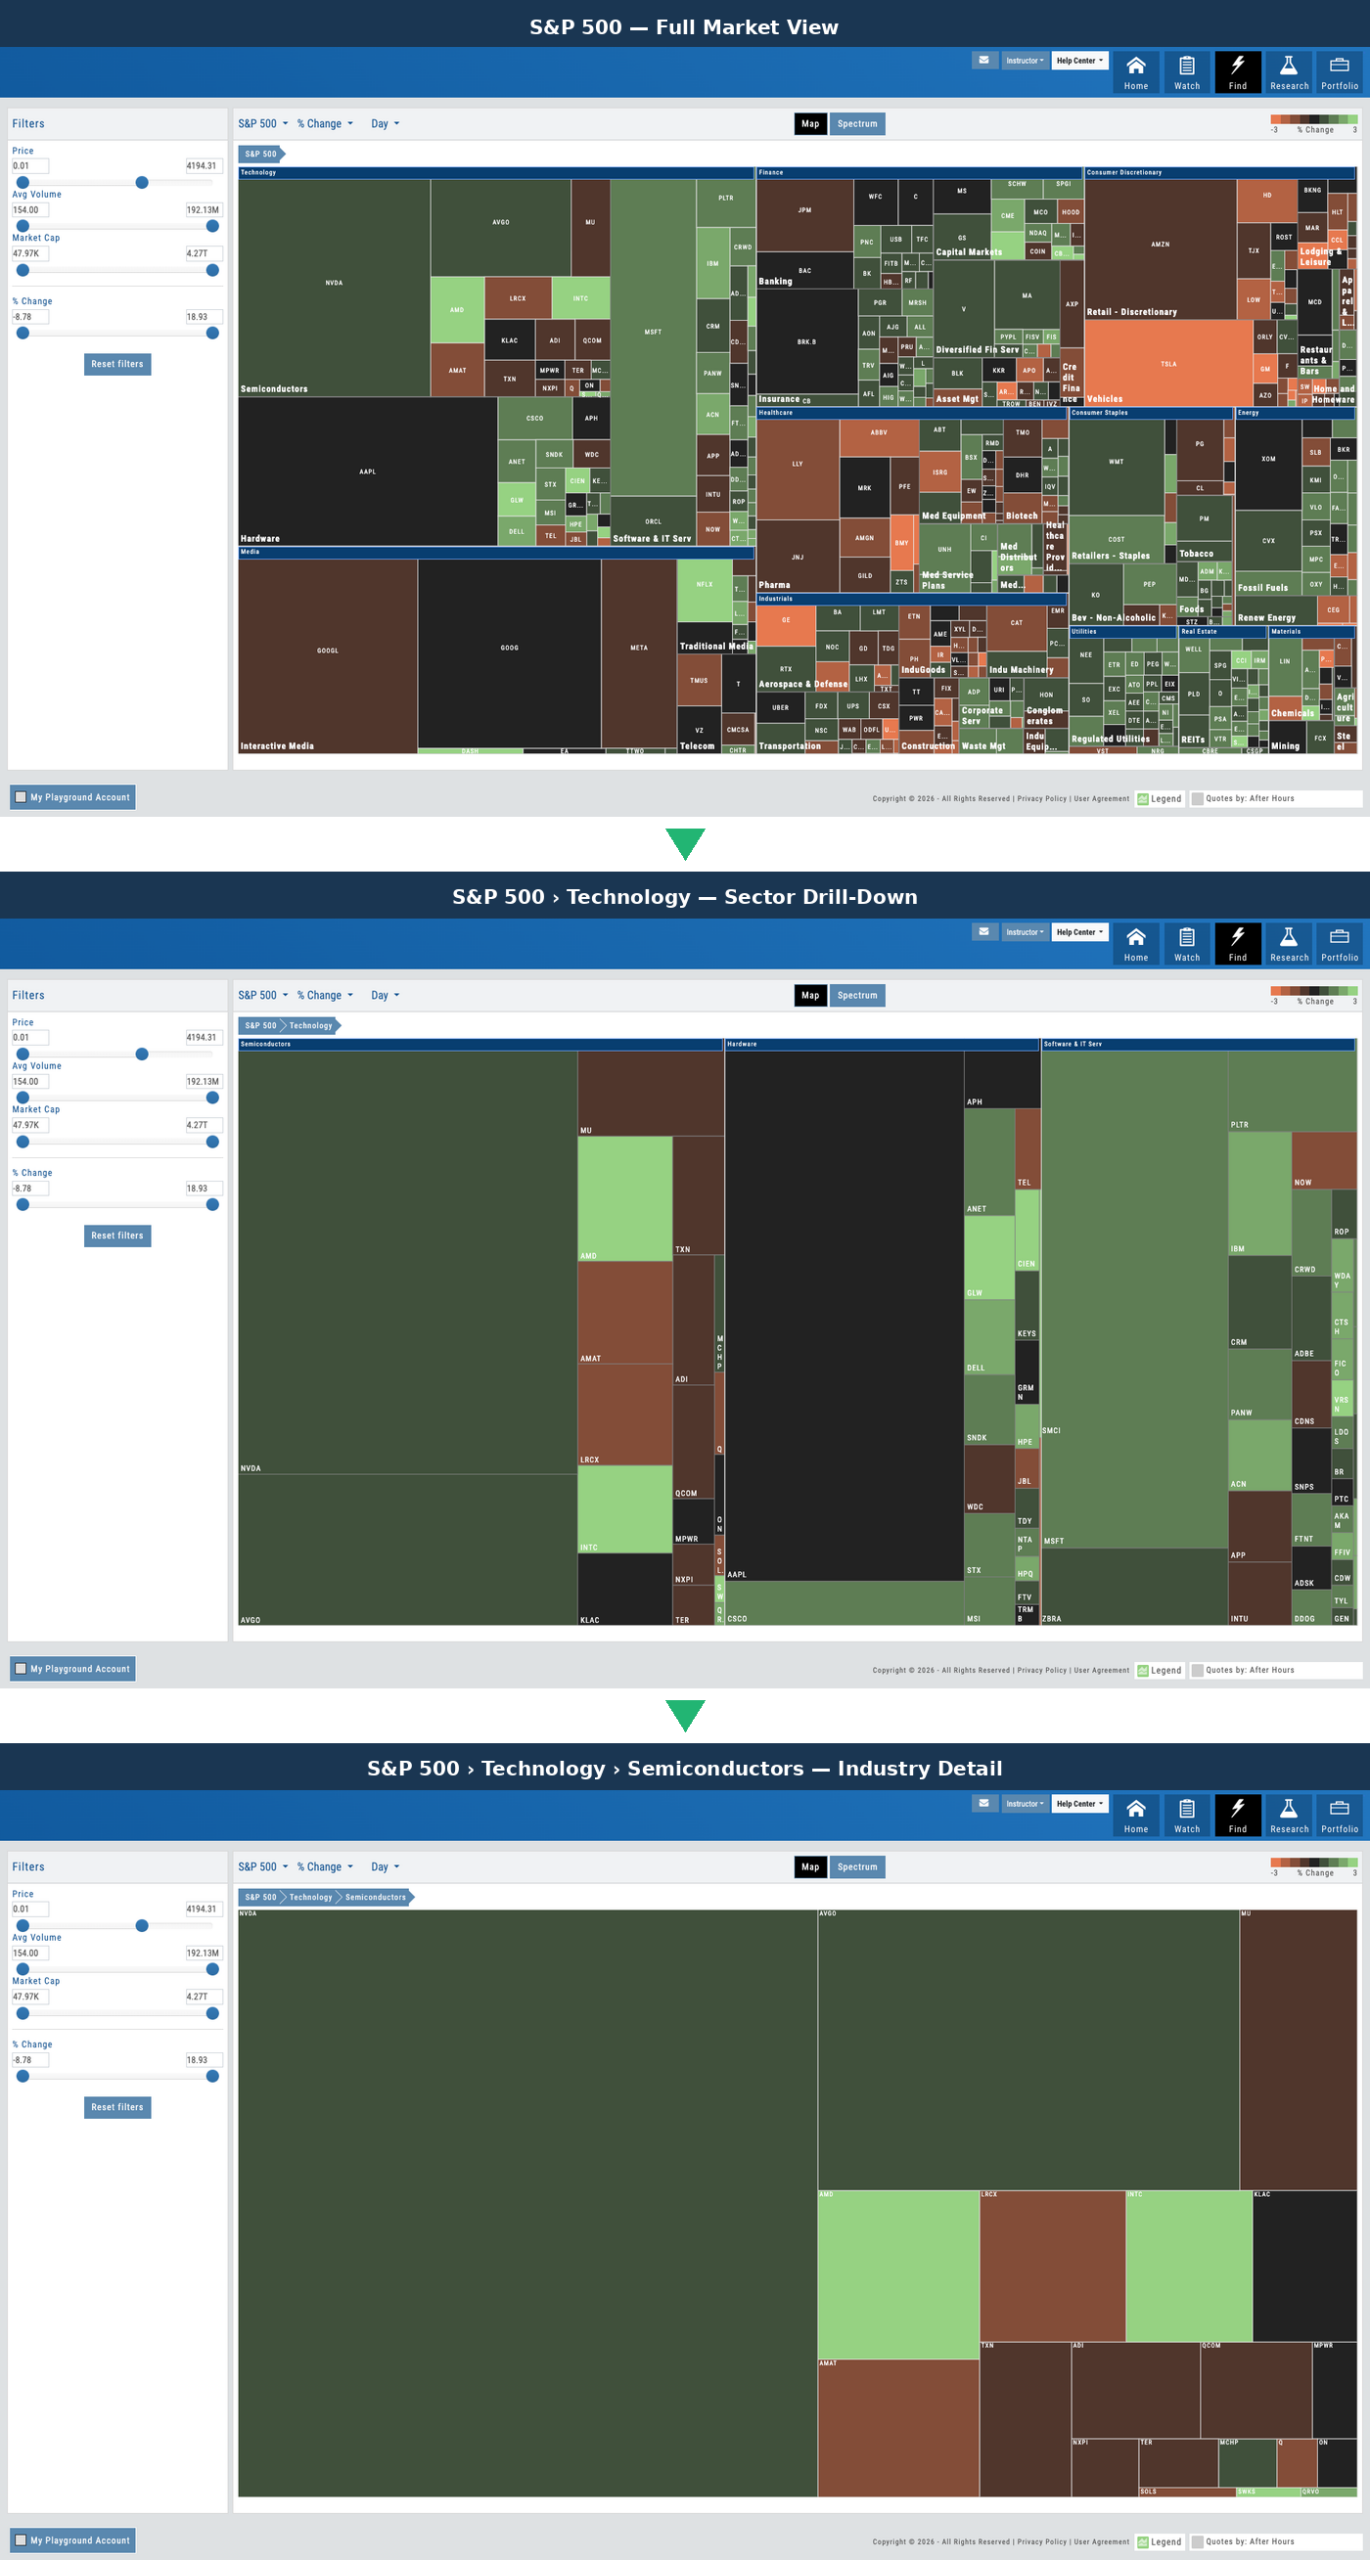
Progression from full market heatmap to sector view to individual stocks
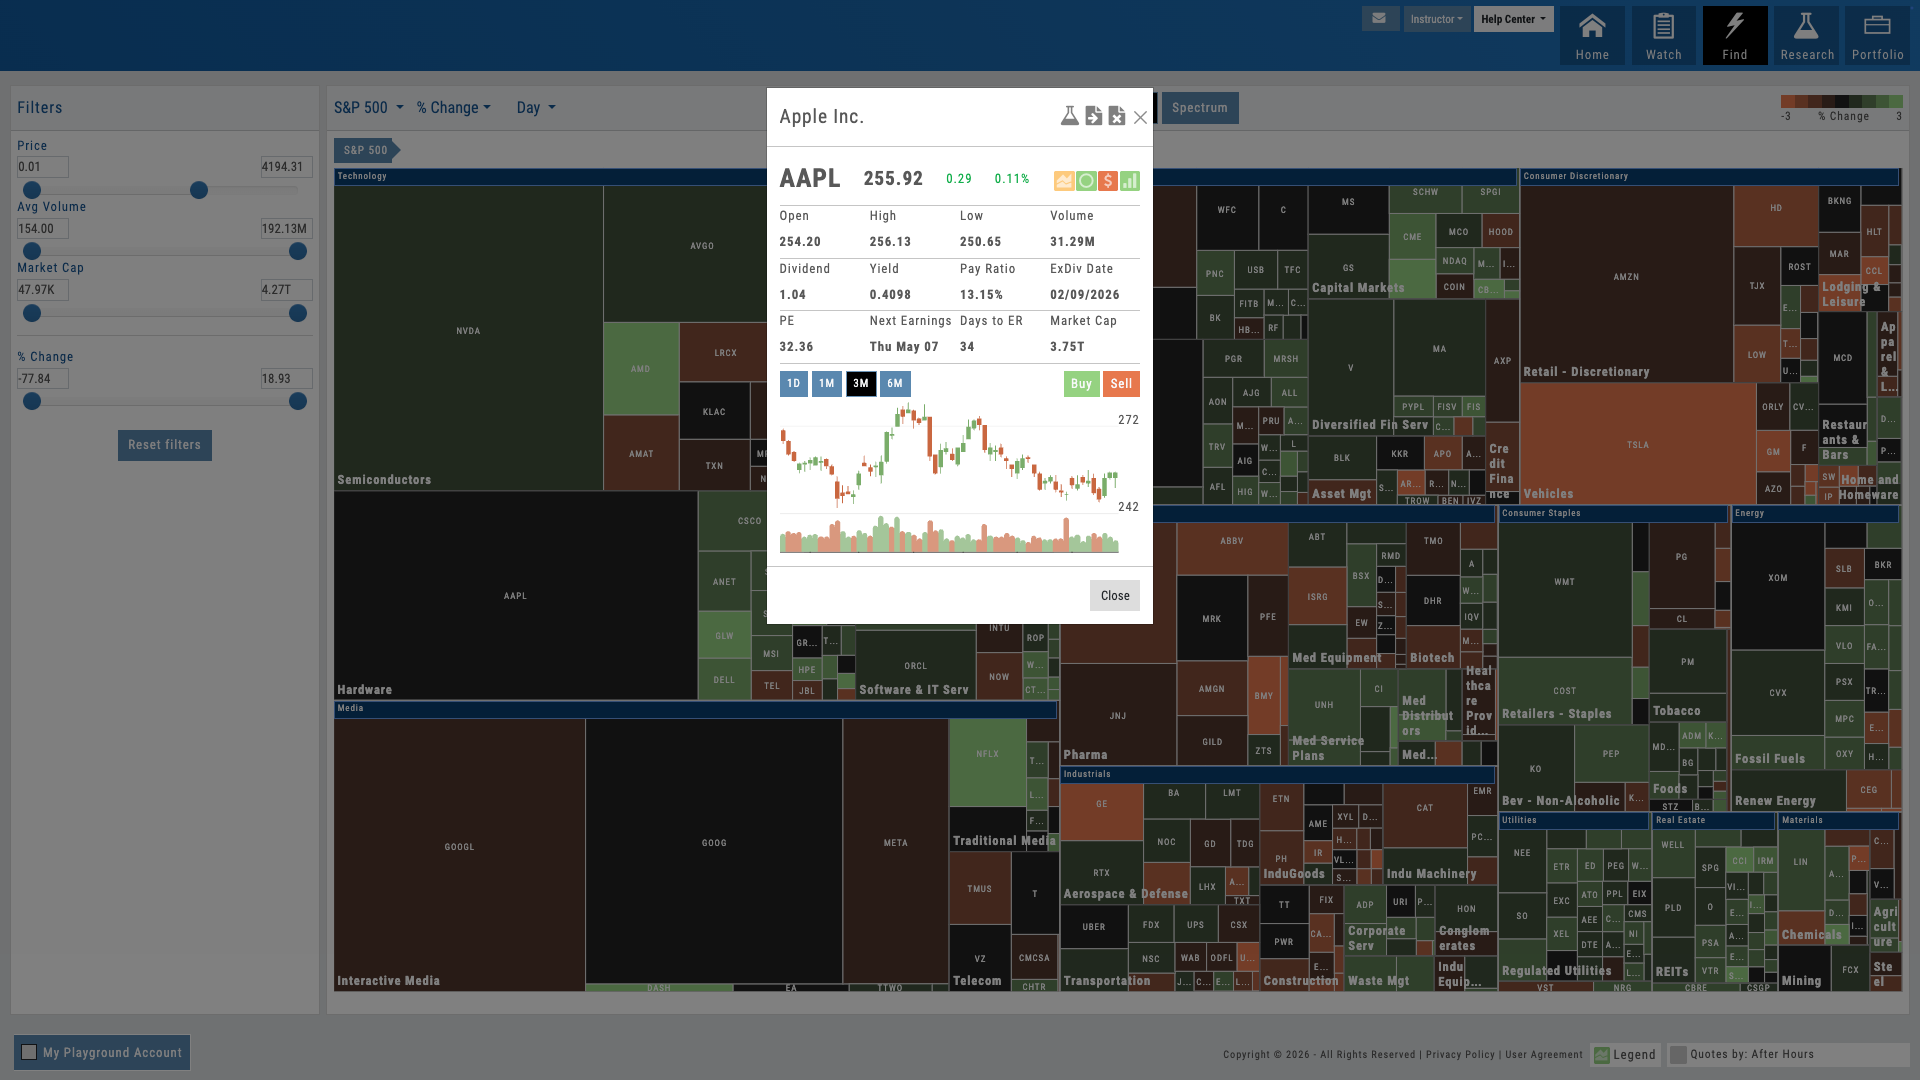
Stock selected on heatmap, Research Dashboard opens with proprietary scores
02 — Workflow Continuity
One Click to Research
Find a stock on the heatmap. Click it. Land in the Research Dashboard with all four proprietary scores loaded.
Discovery should lead to effortless analysis. Click any stock on the heatmap and jump directly to the Research Dashboard — where all four proprietary scores are already calculated and waiting. No separate login. No duplicate searches. The workflow is seamless: discover on the heatmap, research in the dashboard, chart on the platform, trade when ready.
For educators, this continuous workflow teaches students the research process: market context first, then fundamentals, then technicals, then execution. The heatmap is the entry door. Everything else flows from one click.
- Click any stock on the heatmap → jump to Research Dashboard
- Four proprietary scores pre-loaded: Growth, Value, Quality, Momentum
- No duplicate work, no context switching — stay in one platform
- Research → Chart → Trade — continuous workflow under your brand
Want Your Students to Start Every Session with Market Context?
The heatmap is your market discovery tool — deployed as part of your branded platform.
03 — Market Intelligence
Multiple View Modes
Same structure, different metrics. View performance, volume, or other market drivers — all in one click.
The heatmap isn’t limited to performance. Toggle between view modes to see the market through different lenses: performance shows winners and losers; volume shows where the action is; other metrics reveal divergences and opportunities. The visual structure stays consistent — sectors and industries in the same hierarchical layout — but the meaning of color and size changes with each view.
For traders, this teaches pattern recognition across market dimensions. For educators, it’s a teaching accelerator: “Why is this stock red on performance but blue on volume?” The heatmap makes these questions visual and immediate.
- Performance view — red to green gradient showing winners and losers
- Volume view — block size shows trading activity and liquidity
- Additional metrics — IV, moving averages, or other market drivers
- Consistent structure across all views — learn once, explore many ways
Percent Change With Variable Timeframe
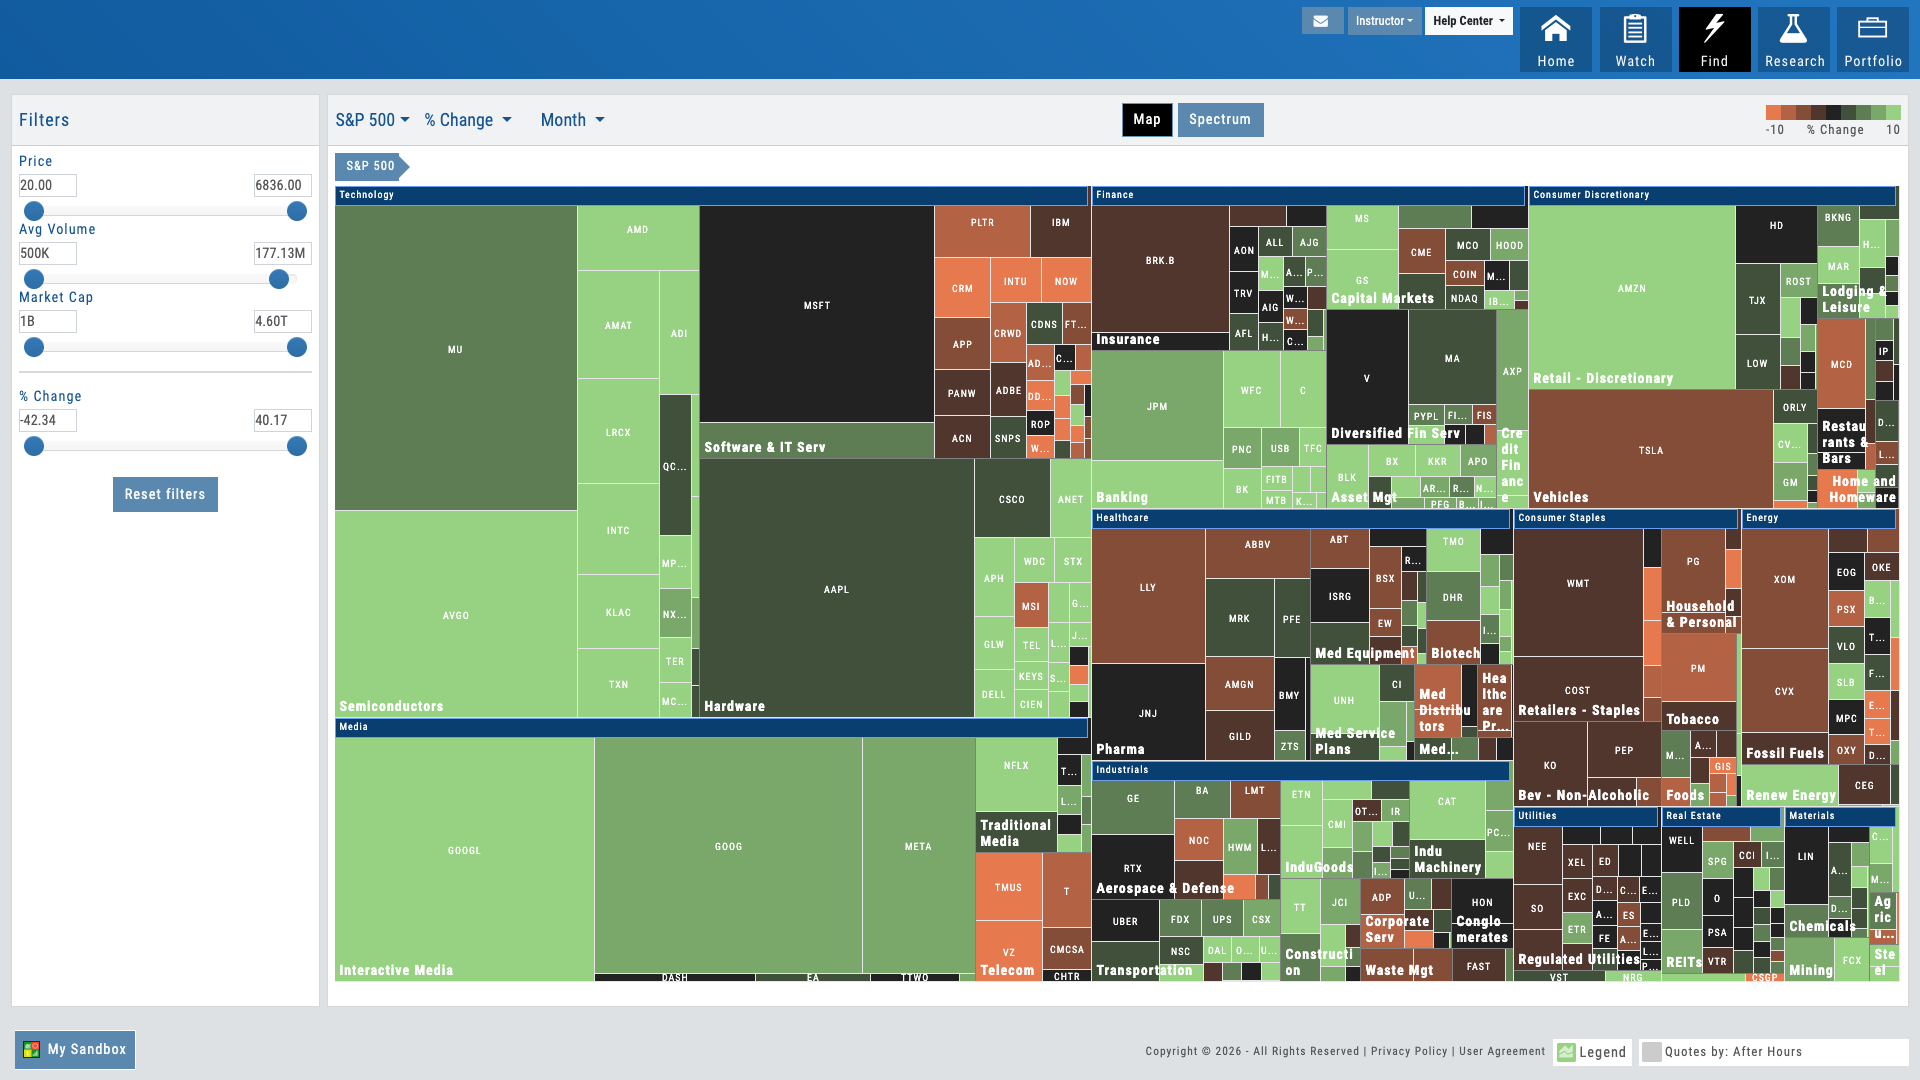
Days Until Earnings
52 Week High-Low Ranking
PEG Ratio — Over or Under Valued
Implied Volatility
Market Discovery Under Your Brand
The heatmap is where exploration begins — full market at a glance, drill-down discovery, one-click research, and 8 AI-powered features across the platform. Your users start every session in context. You get a retention lever that keeps them coming back.
Connects to leading brokerages including Schwab, Tradier, and more. See all supported brokers →
TradeFinder
TradeFinder Module
Options Opportunities, Found for You
Options strategy scans, bullish and bearish trend scans, stagnant market scans, and more. Real-time qualifying trades. One click to trade. Scan Look Back across 10+ years of history. Partner-curated defaults. Stop searching for what to trade — let the platform surface real opportunities in seconds.
TradeFinder Module
Interactive Guide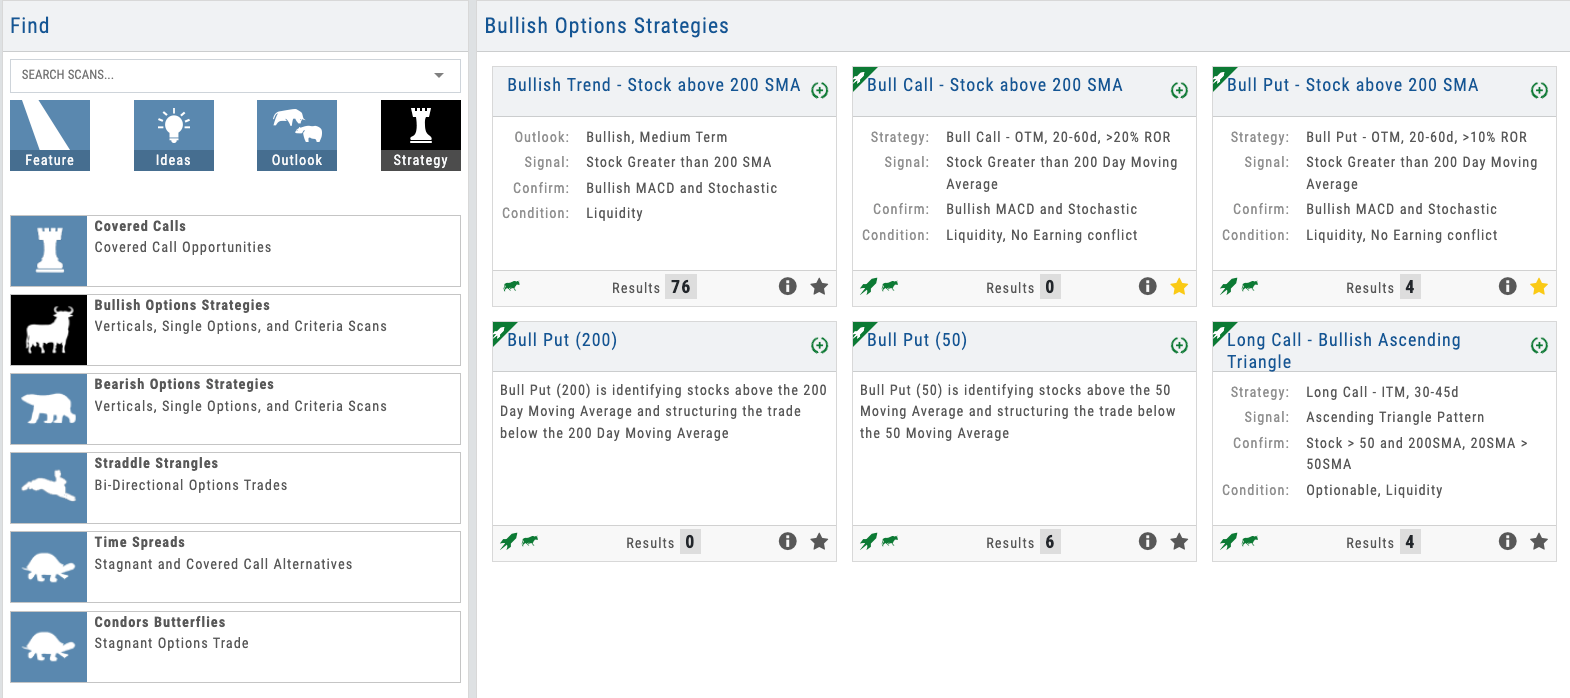
Click the hotspots to explore TradeFinder features
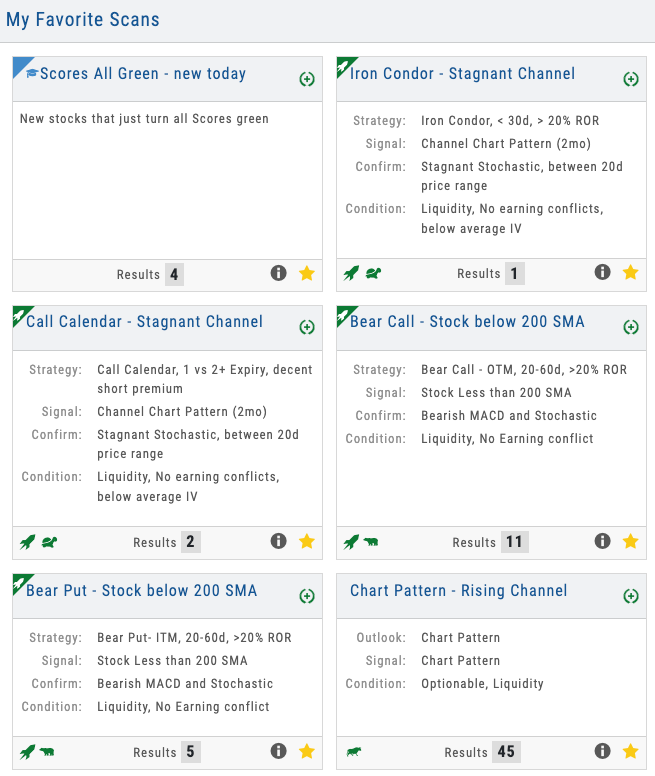
01 — Pre-Built Strategy Scans
Strategies Organized, Trades Ready
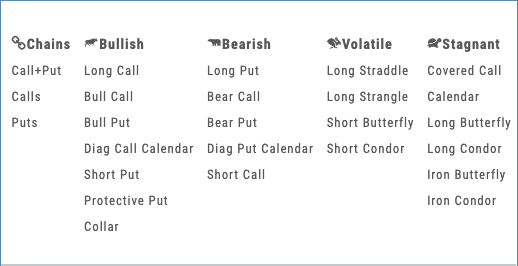
Options strategy scans like Bull Call, Iron Condor, and Covered Call — plus directional scans for bullish trending, bearish trending, and stagnant markets. Each shows qualifying trades in real time.
The scan library eliminates the biggest pain point in trading education: “What should I trade?” Pre-built scans cover options strategies (Bull Call, Iron Condor, Covered Call, and more), directional plays (bullish trending, bearish trending), and market conditions (stagnant, high volatility). Each scan displays the count of real-time qualifying trades.
For educators, this is the bridge between teaching a strategy and trading it. You explain a Bull Call Spread in class. Students open the scan, see 23 qualifying trades right now, click one, and execute. And with Scan Look Back, you can set any scan to any date in the past — over a decade of history — and see exactly what it would have surfaced. It’s a confidence builder: students and partners can verify the scans work before committing real capital.
- Options strategy scans — Bull Call, Iron Condor, Covered Call, Straddle, and more
- Directional scans — bullish trending, bearish trending, stagnant markets
- Real-time count of qualifying trades per scan
- Scan Look Back — set any scan to any past date across 10+ years of history
- Partners can add custom scans designed for their specific strategies
Scan list showing Bull Call Spreads, Iron Condors, and other strategies with live result counts
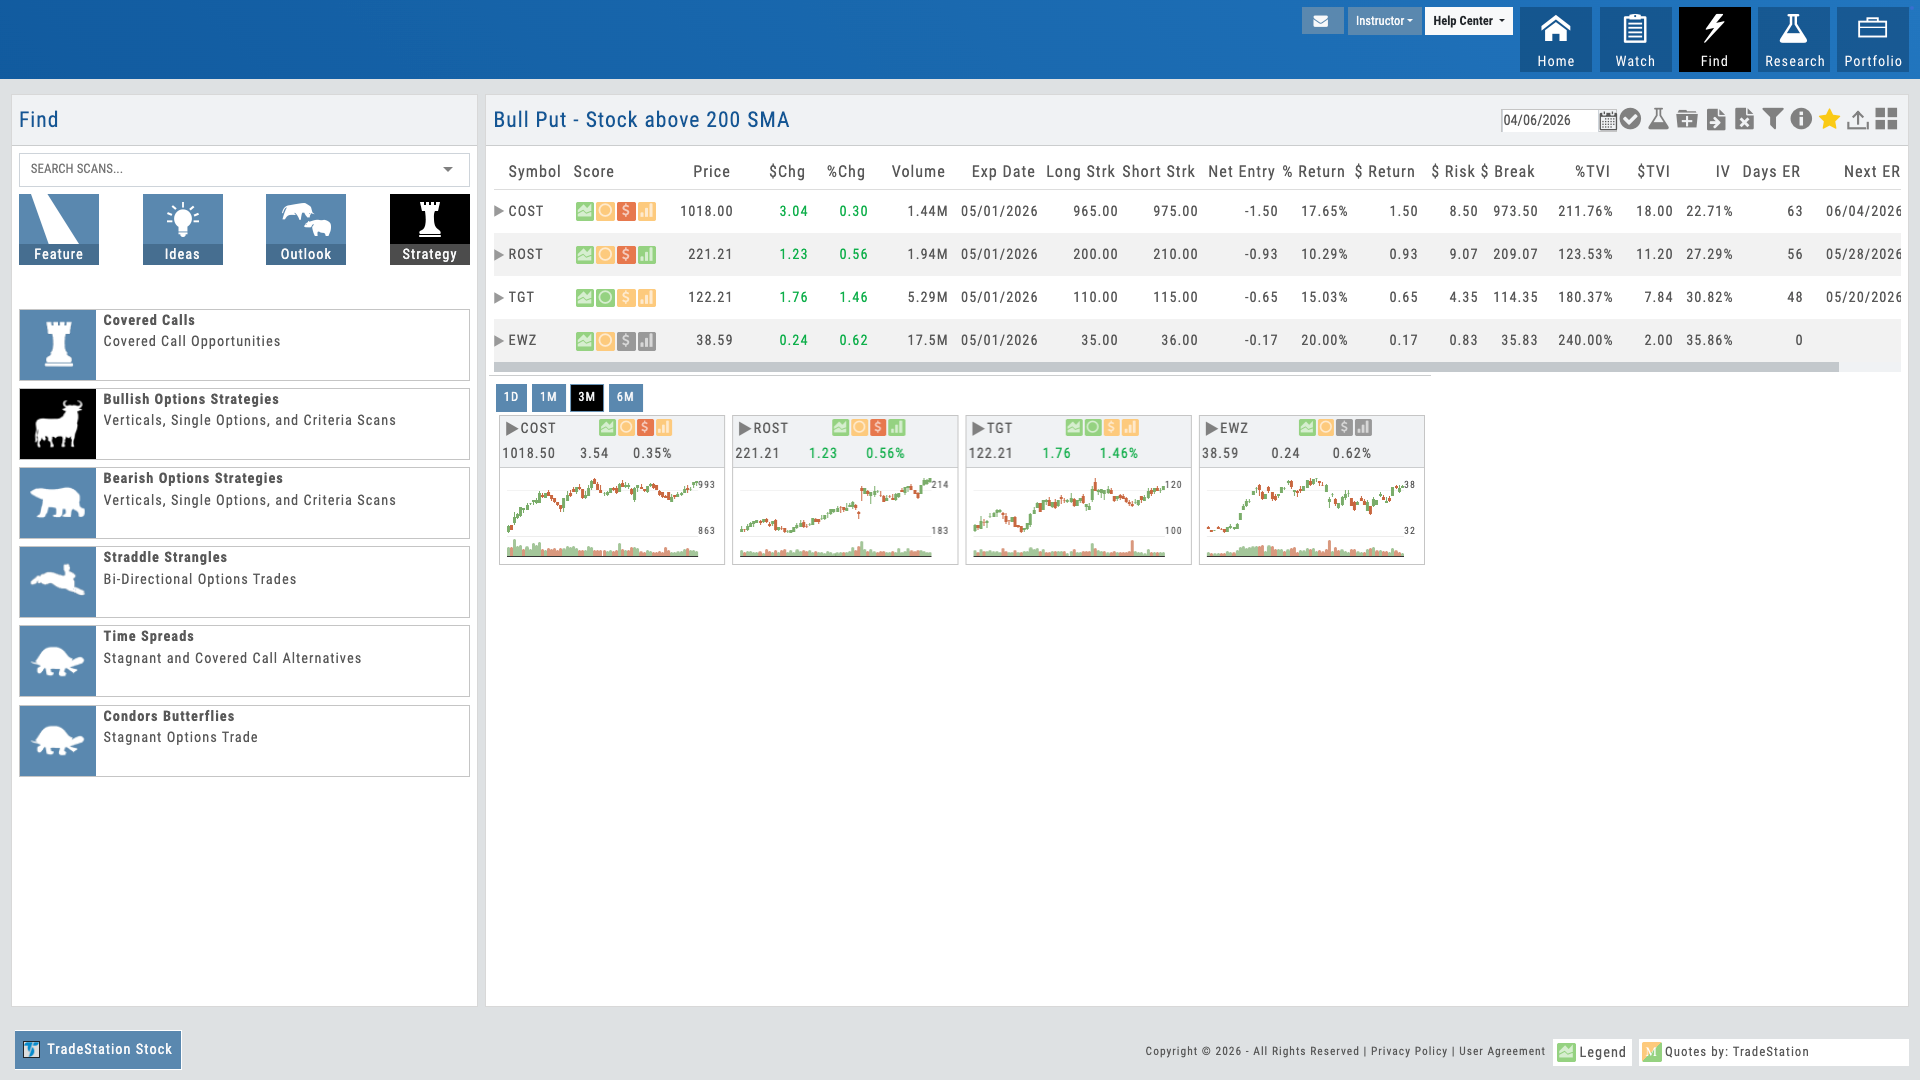
Found trade in TradeFinder opens in Options Analytics with strategy pre-loaded
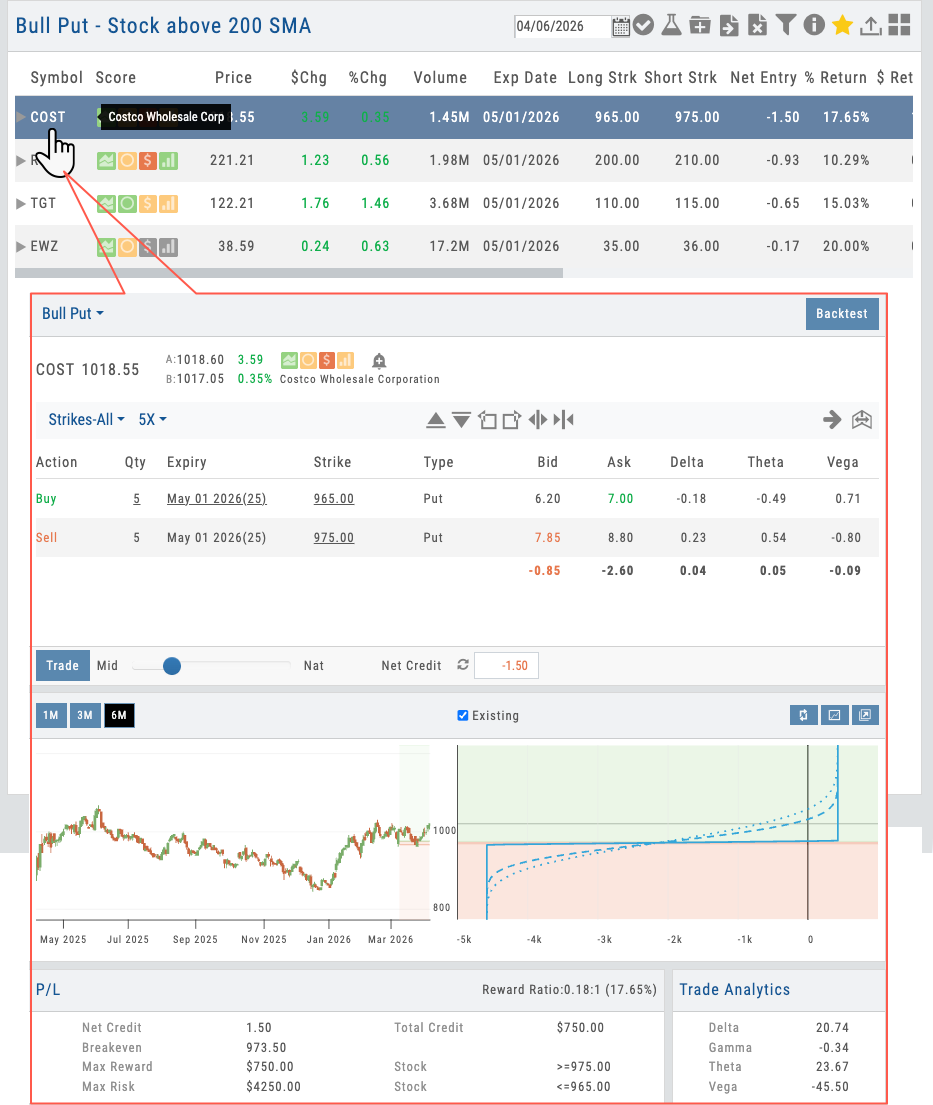
02 — Scan to Trade Flow
One Click Opens in Analytics
Find a trade in TradeFinder. One click opens it in Options Analytics with the strategy pre-loaded and guardrails active.
The real magic happens in the handoff. A student finds a Bull Call Spread candidate in TradeFinder. One click opens it in Options Analytics with the Bull Call Spread structure already built. Guardrails remain active — they can’t accidentally break the strategy structure, even when building from a scan. They adjust the width, refine the strike selection, check the risk, and execute.
This workflow continuity proves that discovery and execution are deeply integrated. Students learn by finding real trades under real market conditions, not in a vacuum.
- Click a scan result to open in Options Analytics
- Strategy structure pre-loaded and ready for adjustment
- Guardrails remain active for safe trade building
- Single workflow from discovery through execution
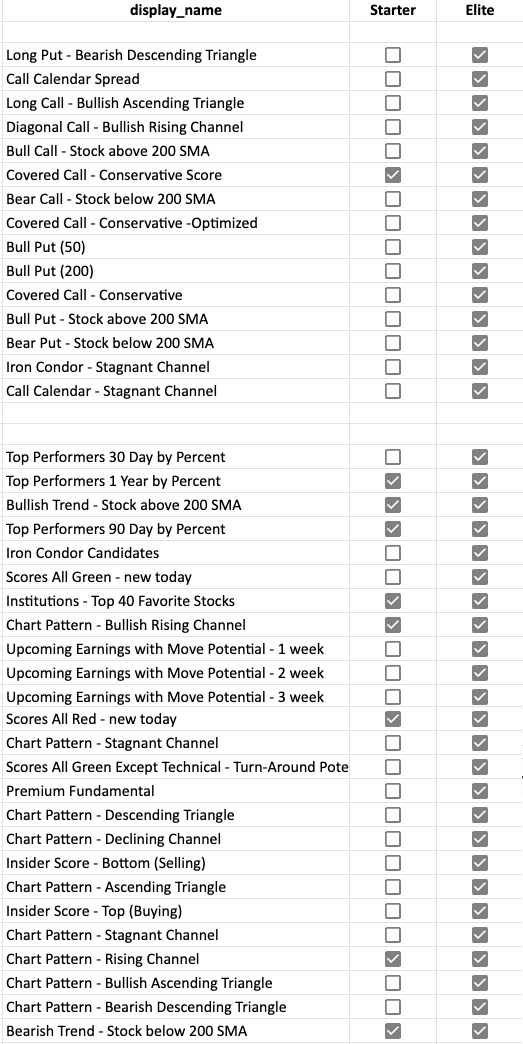
03 — Partner-Curated Defaults
You Control the Scans They See
Use your Admin Account to set which scans appear by default. Your students start with a curated, guided discovery experience.
This is the B2B money shot. Partners use the Admin Account to designate their favorite scans — the strategies they teach most, the ones most relevant to their students. When a new student logs in, they see your curated scan list first. It’s guided discovery under your brand.
You’re not just offering a tool — you’re offering an onboarding experience. Your students get a hand-picked entry point into options trading, not a bewildering wall of 50 choices. That curation is a teaching statement that deepens student trust and dramatically accelerates their time to first trade.
- Admin Account controls default scan visibility
- Mark your preferred scans to appear first
- Students still see all available scans — your defaults are just highlighted
- Updates push instantly to all your users
Admin Account interface showing scan selection and ordering controls
Want Your Students to Find Options Trades in Seconds?
Pre-built scans, real-time results, and your curated defaults — deployed as part of your branded platform.
Dashboard showing 6+ scans running simultaneously with different result counts and market indicators
04 — Multiple Strategies at a Glance
Breadth in One View
See 6+ different scan types running simultaneously — different result counts show where opportunities are strongest right now.
The scan dashboard shows all scans running in parallel. Bull Call Spreads show 12 qualifying trades. Iron Condors show 8. Bullish trending shows 47. That variation communicates important information: market conditions favor some strategies right now over others. It also teaches diversification — when options scans are quiet, directional scans may be generating signals.
Students can refine filters on any scan — tighten or loosen the criteria, adjust time to expiration, change probability thresholds. And Scan Look Back lets them verify any scan against historical conditions: set it to March 2020, October 2022, or any date across 10+ years and see what it would have returned. It builds confidence in the scans and turns historical markets into a teaching lab.
- All scans run in parallel — options strategies, directional, and market condition scans
- Different result counts show where market conditions favor certain approaches
- Refinement filters available on each scan
- Scan Look Back — verify any scan against 10+ years of historical markets
Options Guided Discovery Under Your Brand
Options strategy scans, directional scans, Scan Look Back across 10+ years, real-time results, one-click execution, and your curated defaults — all deployed as part of your branded trading platform. Your students get the easy button for trade discovery. You get the tool that proves you understand their biggest pain point.
Connects to leading brokerages including Schwab, Tradier, and more. See all supported brokers →
Research
Research Module
Proprietary Research No Competitor Can Match
Four proprietary scores on every symbol. 165 key ratios with industry benchmarks and customizable views. Compare up to 6 stocks across every metric. Visual financial analysis for non-finance users. 8 research sub-tabs. 25,000+ companies. AI-powered analysis. The most comprehensive research depth available — and all under your brand.
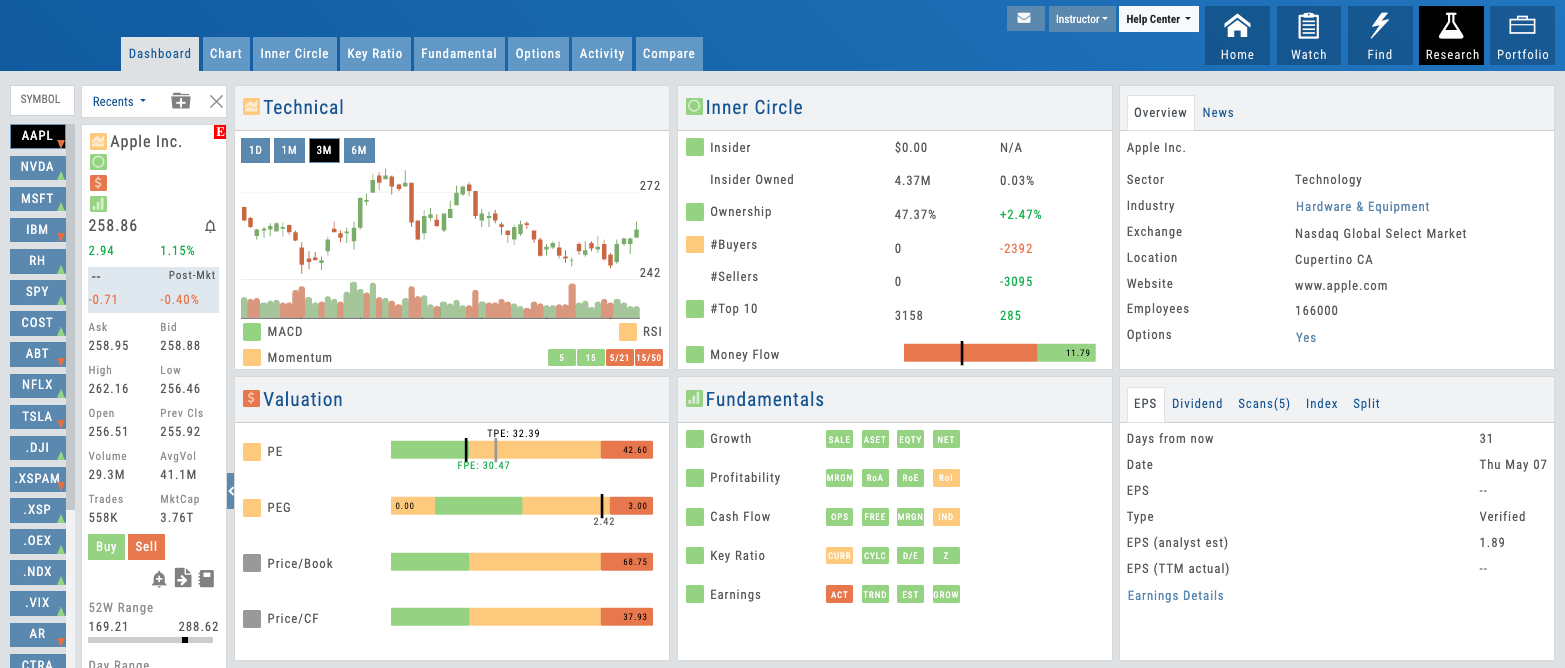
Research Dashboard showing 4 proprietary score quadrants
01 — Proprietary IP
4 Proprietary Scores on Every Symbol
Technical, Inner Circle, Valuation, and Fundamentals — proprietary research depth your competitors cannot offer.
No competitor offers proprietary scores like these. Each of the four — Technical, Inner Circle, Valuation, and Fundamentals — combines data sources and algorithms iVest+ has built from the ground up. They’re the reason your users will choose your platform over anyone else’s.
The Technical Score aggregates momentum, volatility, and trend strength. Inner Circle combines insider Form 4 filings with institutional position changes to show you where the smart money is. Valuation uses multiple methodologies to measure upside and downside. Fundamentals scores earnings quality, balance sheet strength, and growth trajectory.
Every score is clickable. Users can navigate straight to the underlying research view — seeing the exact data, ratios, and benchmarks that generated each score. It’s transparency built in. For partners, this is the ultimate B2B differentiator: you’re offering proprietary research IP that no competitor can replicate. Your users get analytical depth that makes your platform the only tool they need.
- Technical Score — Momentum, trend, volatility at a glance
- Inner Circle Score — Smart money signal from insider and institutional data
- Valuation Score — Upside/downside measured by multiple methodologies
- Fundamentals Score — Earnings quality, balance sheet, growth assessment
- All 4 scores clickable for deep-dive research views
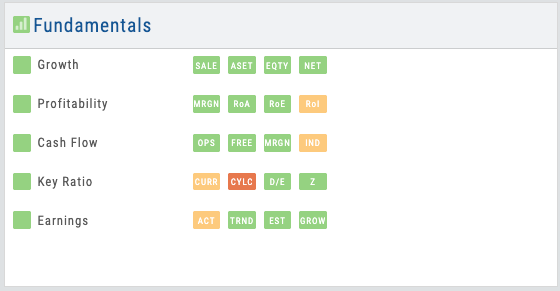
4 score quadrants — Technical, Inner Circle, Valuation, Fundamentals
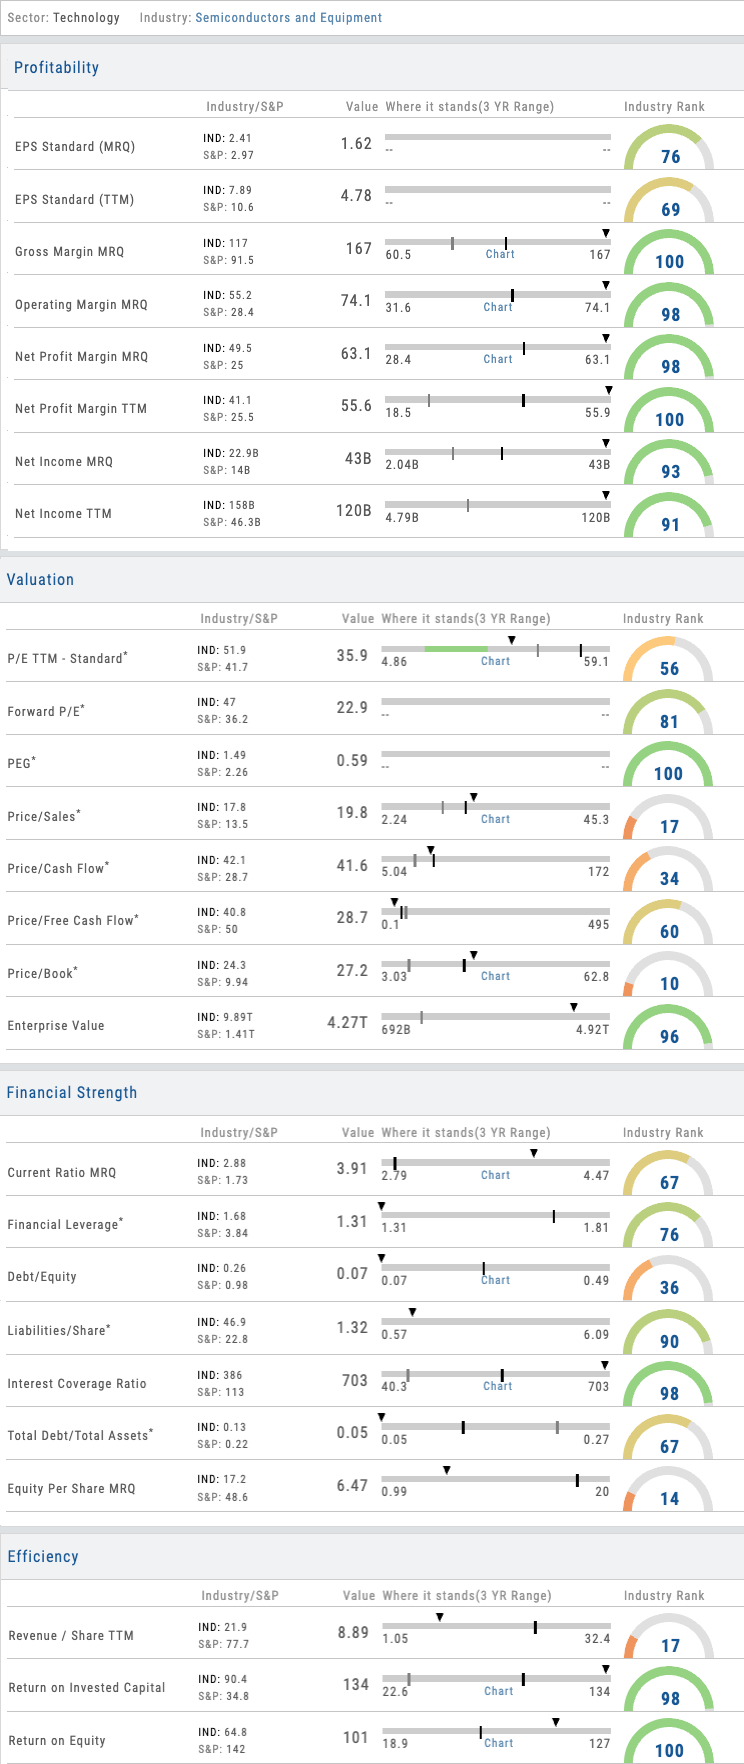
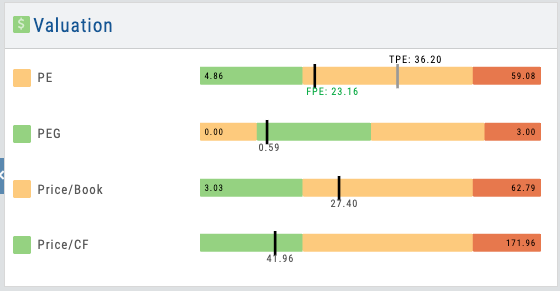
Bullet charts showing 3-year range with industry and S&P benchmarks
02 — Data Depth
165 Key Ratios with Industry Benchmarks
Organized into 6 data sections. Bullet charts show 3-year range with industry and S&P 500 benchmarks.
The Key Ratios view is where analytical depth becomes visible. 165 metrics organized across six sections — Valuation, Profitability, Efficiency, Leverage, Liquidity, and Growth. Each ratio appears as a bullet chart showing the company’s current position, 3-year range, where the industry group average sits, where the S&P 500 average sits, and the stock’s percentile rank compared to its industry group.
With 165 ratios, organization matters. That’s why the platform includes customizable views: Balanced (most commonly used ratios), Swing Trader, Position Trader, and Investor — each pre-configured to surface the ratios most relevant to that style. And here’s the B2B lever: partners can create custom views for their users that align to their specific education or strategy methodology. Your students see the ratios that matter for what you teach, not a wall of 165 numbers.
- 165 key ratios across Valuation, Profitability, Efficiency, Leverage, Liquidity, Growth
- Bullet charts: current value, 3-year range, industry average, S&P 500, percentile rank
- Pre-built views: Balanced, Swing Trader, Position Trader, Investor
- Partners create custom views aligned to their education and strategies
- Real-time updates from 25,000+ company data pool
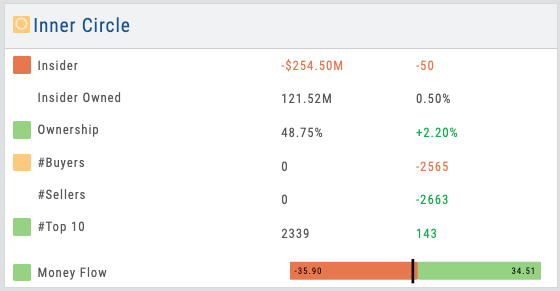
03 — Smart Money Signal
Inner Circle — The Smart Money Signal
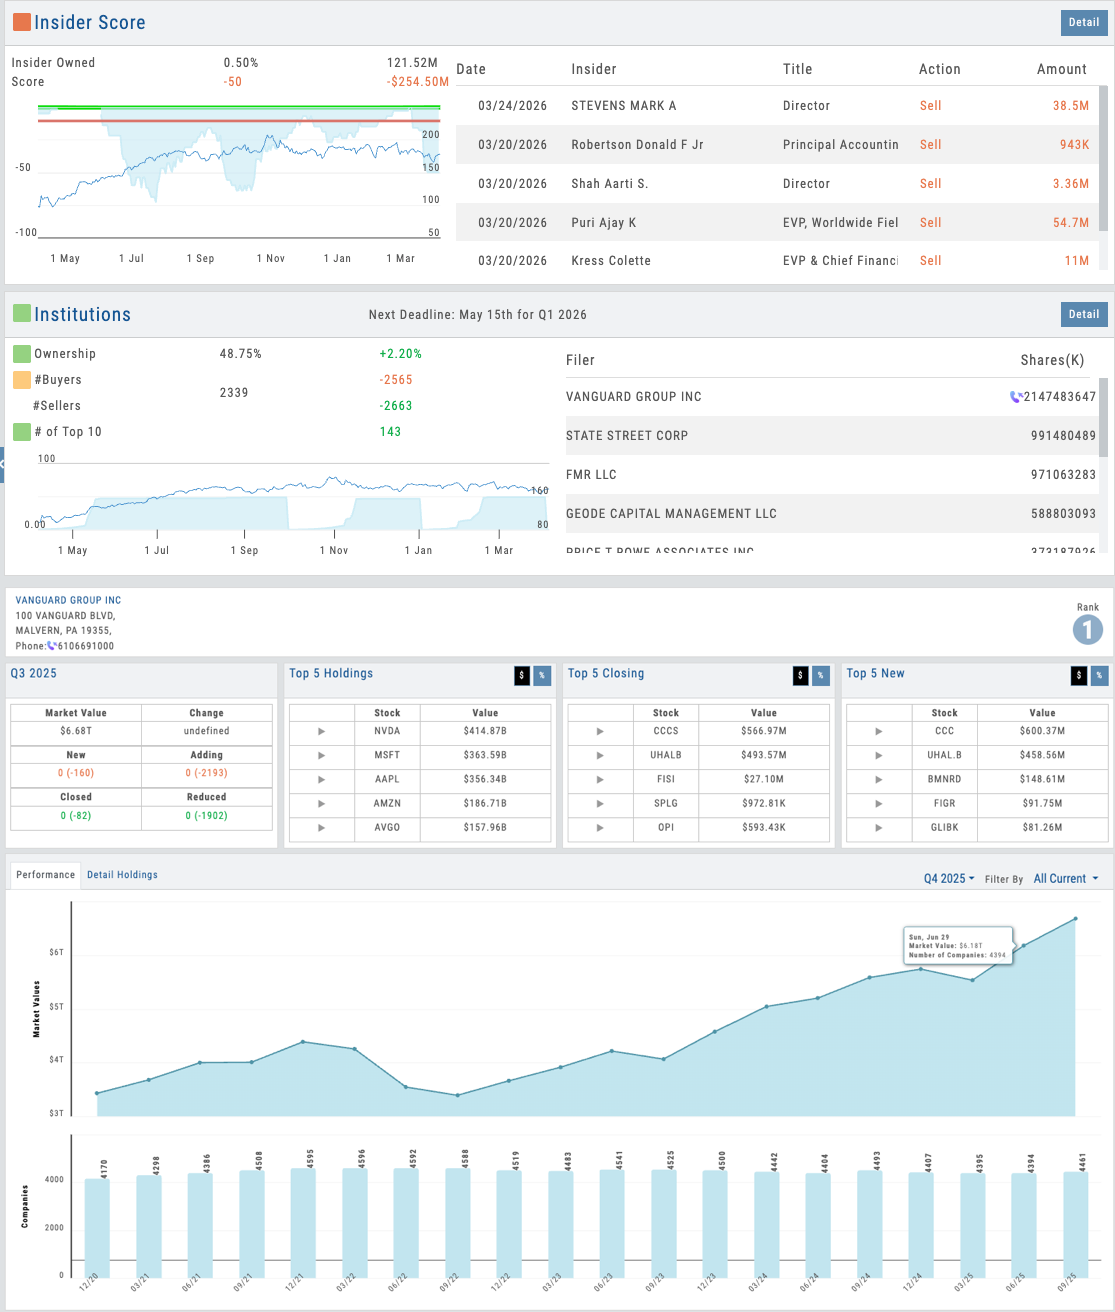
Insider Form 4 filings combined with institutional position changes. Who’s buying, who’s selling, and at what scale.
The Inner Circle score tracks insider transactions and institutional positioning simultaneously. When executives are buying — or dumping — you see it. When major institutions are accumulating shares or reducing positions, the signal appears. Combined, these two data sources create what might be the single most actionable research insight: the smart money signal.
Insiders know their business better than anyone. Institutions move capital on the highest conviction. When both are pointing the same direction, it matters. The Inner Circle view breaks this down: you see each insider filing, the transaction direction and size, the institutional moves by quarter, and a narrative on the direction. For traders, this is a critical research layer. For partners, it’s a research depth story that resonates with users.
- Insider Form 4 filings with transaction details, dates, and ownership context
- Institutional position changes by quarter with institution names and stake sizes
- Directional summary: buying signal vs. selling signal vs. mixed
- Timeline view showing transaction history over time
- Screens and filters to find matching opportunities across 25,000+ symbols
Inner Circle view showing insider filings and institutional position changes timeline
Want to Offer Proprietary Research Under Your Brand?
Four proprietary scores, 165 key ratios with customizable views, 6-stock comparison, visual fundamentals, and AI-powered analysis — deployed as part of your branded platform. Your users get research depth no competitor can match.
Interactive simulation showing adjustable EPS, Growth Rate, PE, and Discount Rate with live projected price
04 — Dividends & Valuation Modeling
Earnings, Dividends & Interactive Simulation
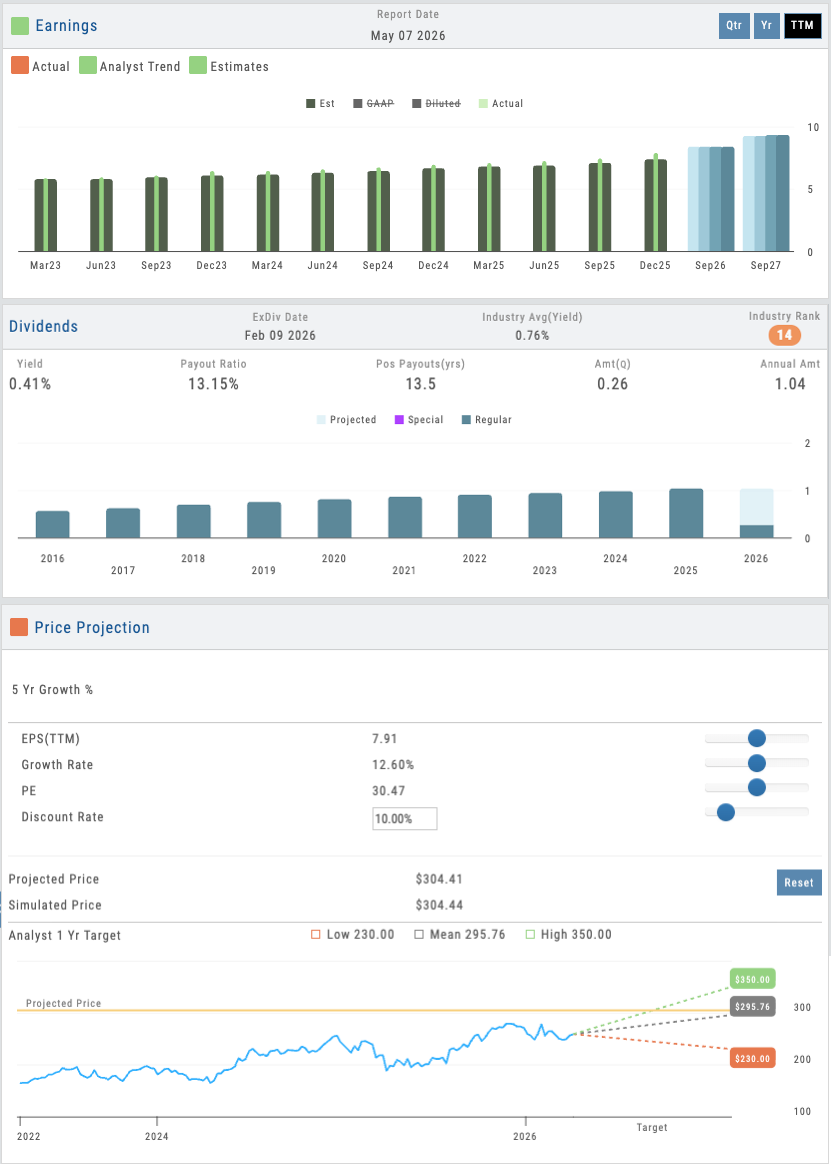
Analyst price projections, earnings history, dividend quality tracking, and a user-adjustable valuation model on the fly.
The Earnings & Valuation section shows analyst consensus price targets, historical earnings beats and misses, and forward guidance. The Dividends view lets users track dividend quality over time — see the payout ratio to understand how much of its earnings a company is sharing with shareholders, whether dividends are growing or stagnating, and how sustainable the current yield really is.
But the interactive simulation is where users become analysts themselves. Adjust expected EPS growth, projected PE ratio, discount rate, or growth rate — and watch the fair value estimate update in real time. This isn’t a black-box valuation. It’s transparent. Users see exactly how each assumption flows through to price. When they debate whether a stock is fairly valued at $50 or should be worth $65, they can build the case visually. For educators, this is a powerful teaching tool: students learn valuation methodology by experimenting with assumptions. For all users, it turns passive research consumption into active analytical work.
- Analyst consensus price targets and historical estimates
- Earnings history with actual vs. estimated results
- Dividend quality tracking — payout ratio, growth trend, and yield sustainability
- User-adjustable simulation: EPS, growth rate, PE, discount rate
- Real-time fair value calculation based on inputs
- Transparent methodology showing exactly how value is derived
05 — AI Research
AI-Powered Research Assistant
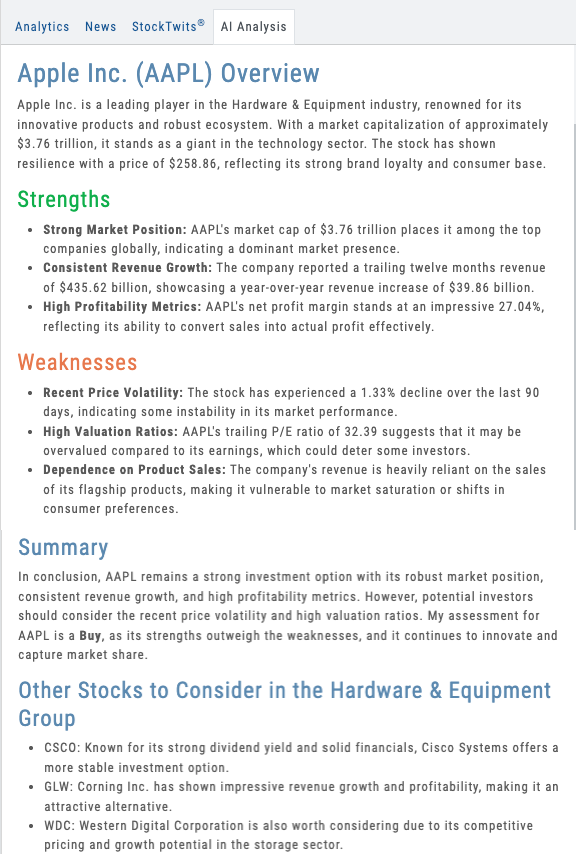
Ask questions about any stock conversationally. Real AI integration with sourced answers — not a chatbot badge.
The AI Analyst is available on every research page. Ask it anything about the company you’re researching: “Why did earnings miss guidance?” “What are the biggest risks to valuation?” “How does this company’s debt load compare to peers?” The AI reads the underlying data — financial statements, conference call transcripts, SEC filings, industry data — and responds with a sourced answer.
This isn’t a generic chatbot. It’s research-specific AI that understands the data it’s analyzing. Every answer includes citations so users can verify claims and dive deeper. And because it’s part of iVest+, your users experience it as part of your platform’s intelligence — not a third-party add-on. One of 8 AI-powered features throughout the platform that deepen research capability and accelerate decision-making.
- Ask questions about any company, sector, or metric
- AI reads financial data, transcripts, SEC filings, industry reports
- Sourced answers with citations for verification
- Available on every research page for instant analysis
- Part of 8 integrated AI features across the platform
AI Analyst panel showing conversational query and sourced research response
Compare view showing 6 stocks with spark charts, scores, and multi-section analysis
06 — Multi-Stock Compare
Compare Up to 6 Stocks Across Every Metric
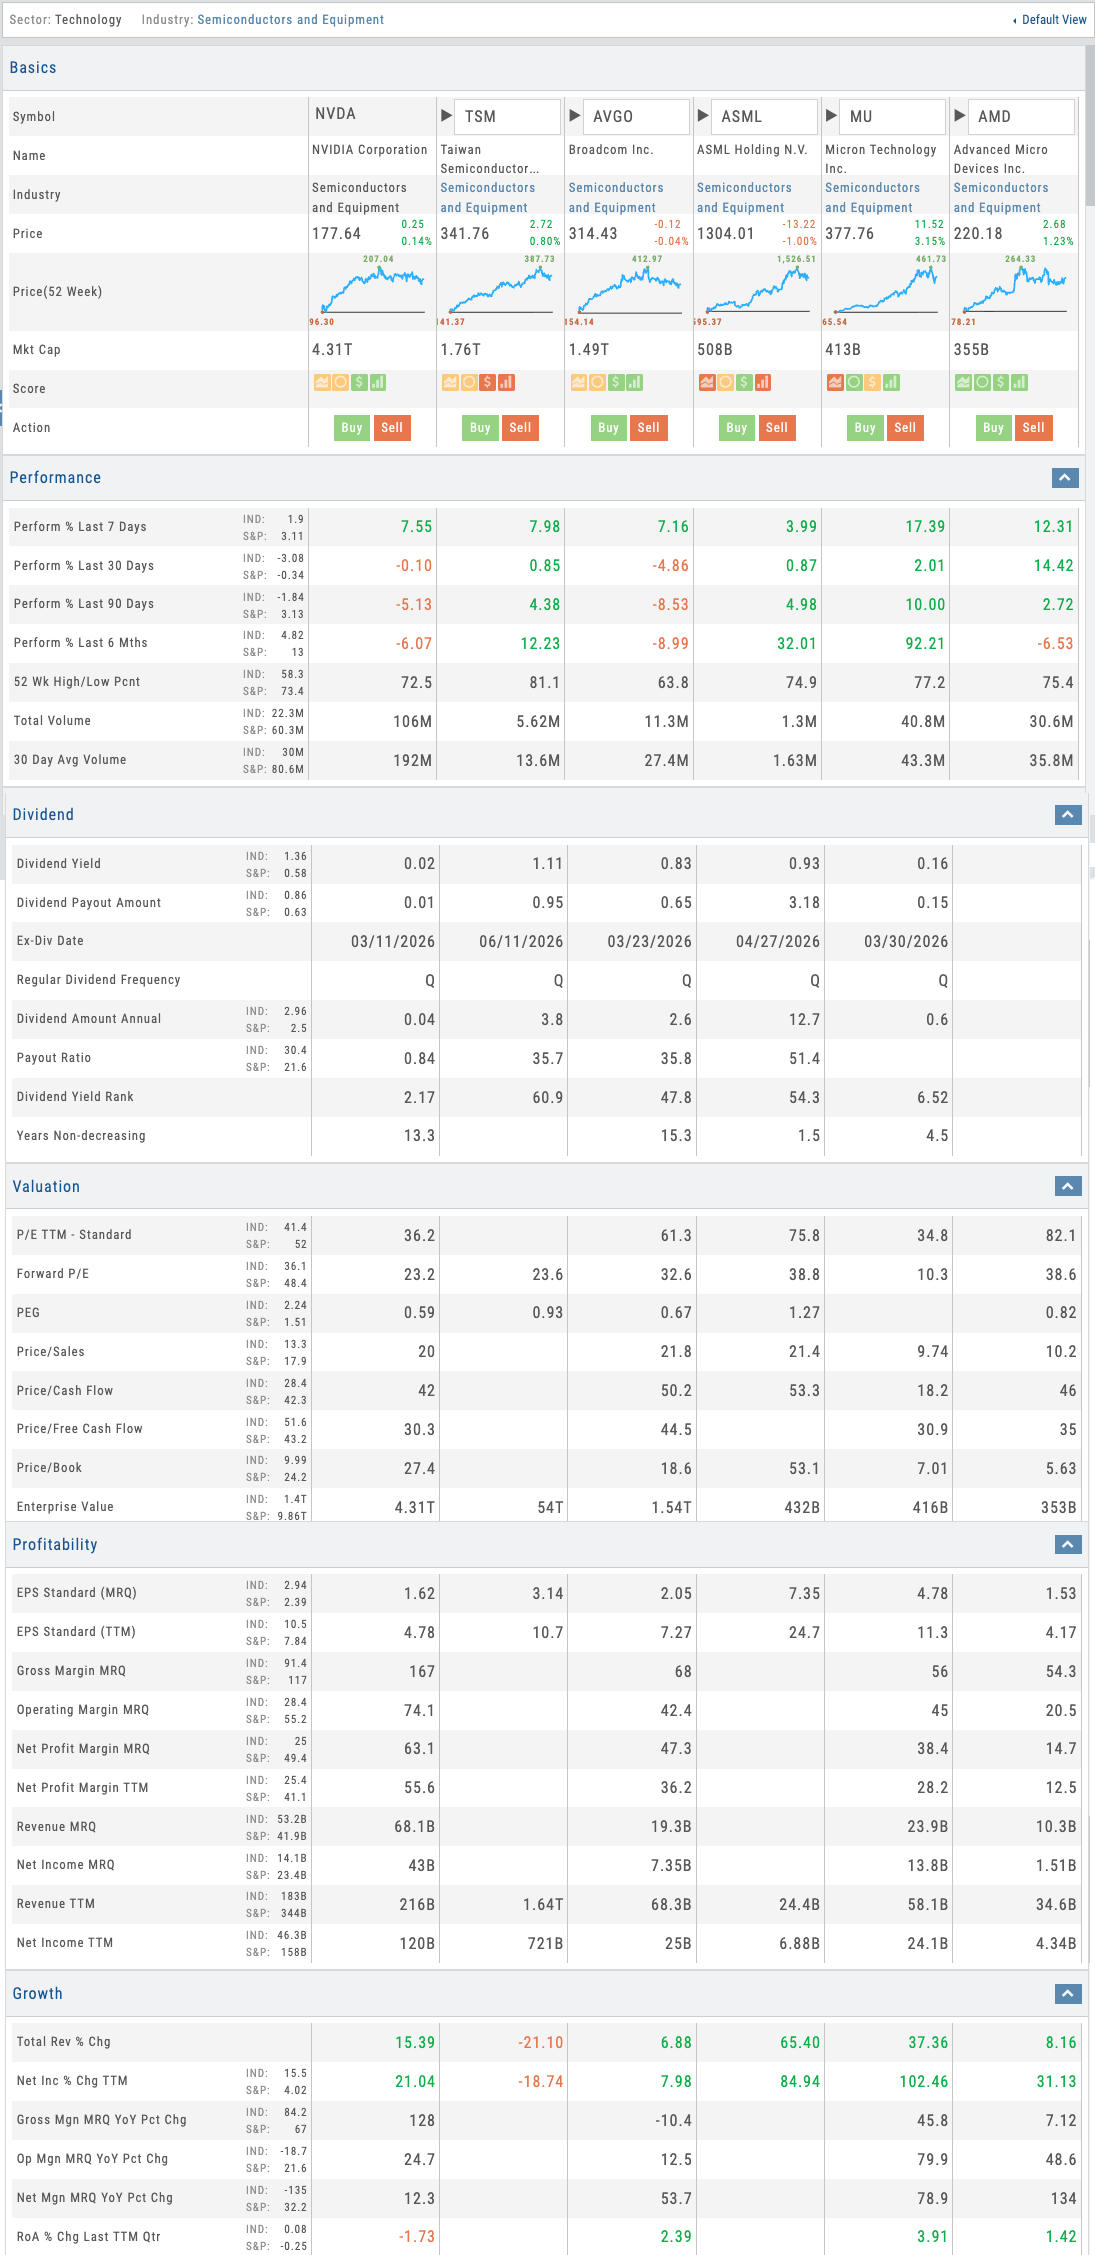
Side-by-side comparison with spark charts, 4-point scores, and deep section analysis — with customizable views.
The Compare tab lets users add up to 5 stocks alongside their selected symbol for a 6-stock side-by-side comparison. At the top level, each stock shows a spark chart marking the 52-week high and low and the current 4-point proprietary score. Below, the comparison breaks into deep sections: Performance, Dividend, Valuation, Profitability, Growth, Efficiency, Cash Flow, Insider and Institutional Activity, Options Activity, and Statistics.
Like Key Ratios, Compare includes the same customizable views — Balanced, Swing Trader, Position Trader, Investor — and partners can build their own. Students comparing Apple to Microsoft to Google don’t need to see all 10+ sections at once. They see the comparison through the lens their educator set up. It’s the fastest way to evaluate a basket of stocks and make relative decisions.
- Compare up to 6 stocks side-by-side across 10+ analysis sections
- Spark charts with 52-week range and 4-point proprietary scores
- Customizable views: Balanced, Swing Trader, Position Trader, Investor
- Partners create custom comparison views for their audience
07 — Visual Financial Analysis
Fundamentals — Visual Analysis for Everyone
Earnings, dividends, analyst projections, price simulation, and full financial statements — all presented visually first, with drill-down to the raw data.
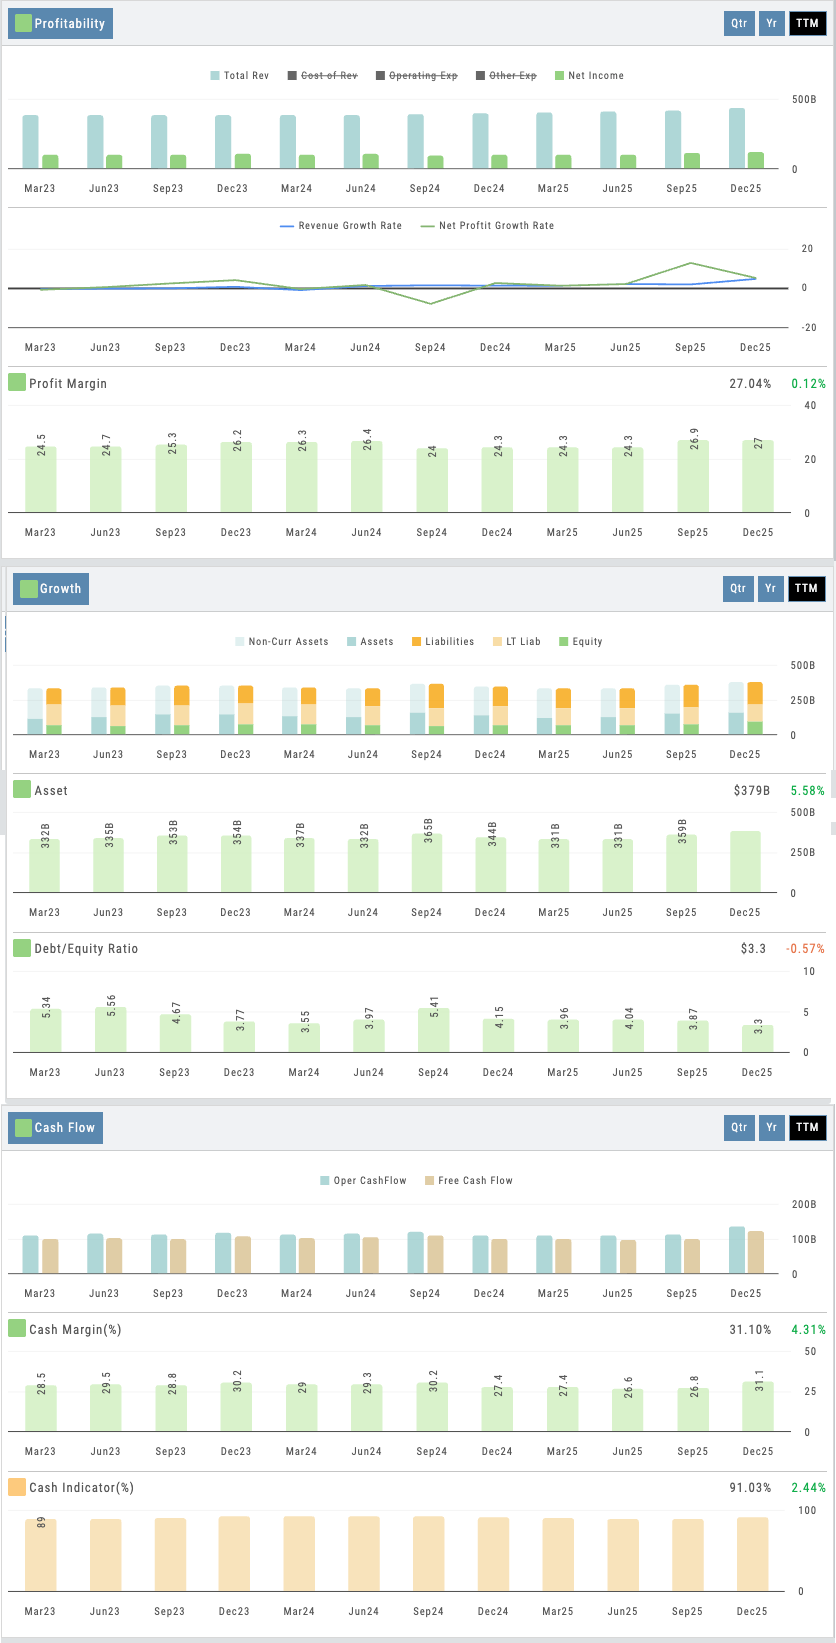
The Fundamentals tab gives users access to earnings history, dividend data, analyst price projections, and a future price simulator — plus the complete P&L statement, balance sheet, and cash flow statement. But here’s what makes it different: all of this data is presented visually first for fast analysis and easy trend identification. Users don’t need a finance degree to spot whether earnings are growing, margins are compressing, or debt is rising.
The full financial reports are available on drill-down for users who want the raw numbers. But the visual layer is the default — charts, trend lines, and color-coded indicators that make fundamental analysis accessible to everyone. This is Visual Analysis for people who aren’t in finance, and it’s exactly what education-focused partners need. Your students engage with fundamentals because they can see the story, not just the spreadsheet.
- Earnings, dividends, analyst projections, and price simulator on one page
- Full P&L, balance sheet, and cash flow statements on drill-down
- Visual-first design: charts and trends before raw numbers
- Accessible fundamental analysis for non-finance audiences
Fundamentals view showing visual earnings, margins, and growth trends with drill-down to full statements
The Activity tab rounds out the research experience — pulling together news, StockTwits social sentiment, AI-powered stock analysis, and the user’s own journal history for each symbol. Users see every trade they’ve ever made on a stock alongside current market context. Research and trading history in one view.
Proprietary Research Under Your Name
Four proprietary scores. 165 key ratios with customizable views. 6-stock comparison across every metric. Visual financial analysis anyone can use. News, social, AI analysis, and journal history per symbol. 8 research sub-tabs. 25,000+ companies. AI-powered analysis. All deployed as part of your branded platform. Your users get research depth that keeps them coming back. Your competitors won’t be able to match it.
Connects to leading brokerages including Schwab, Tradier, and more. See all supported brokers →
Portfolio
Portfolio Module
Every Broker. Every Position. One View.
Multi-broker aggregation. Unified position view. Portfolio Greeks across all holdings. Real-time P&L. Positions visible on every chart and the options page — manage trades from wherever you are. See all accounts in a single dashboard — no context switching.
Unified Portfolio View
Interactive Guide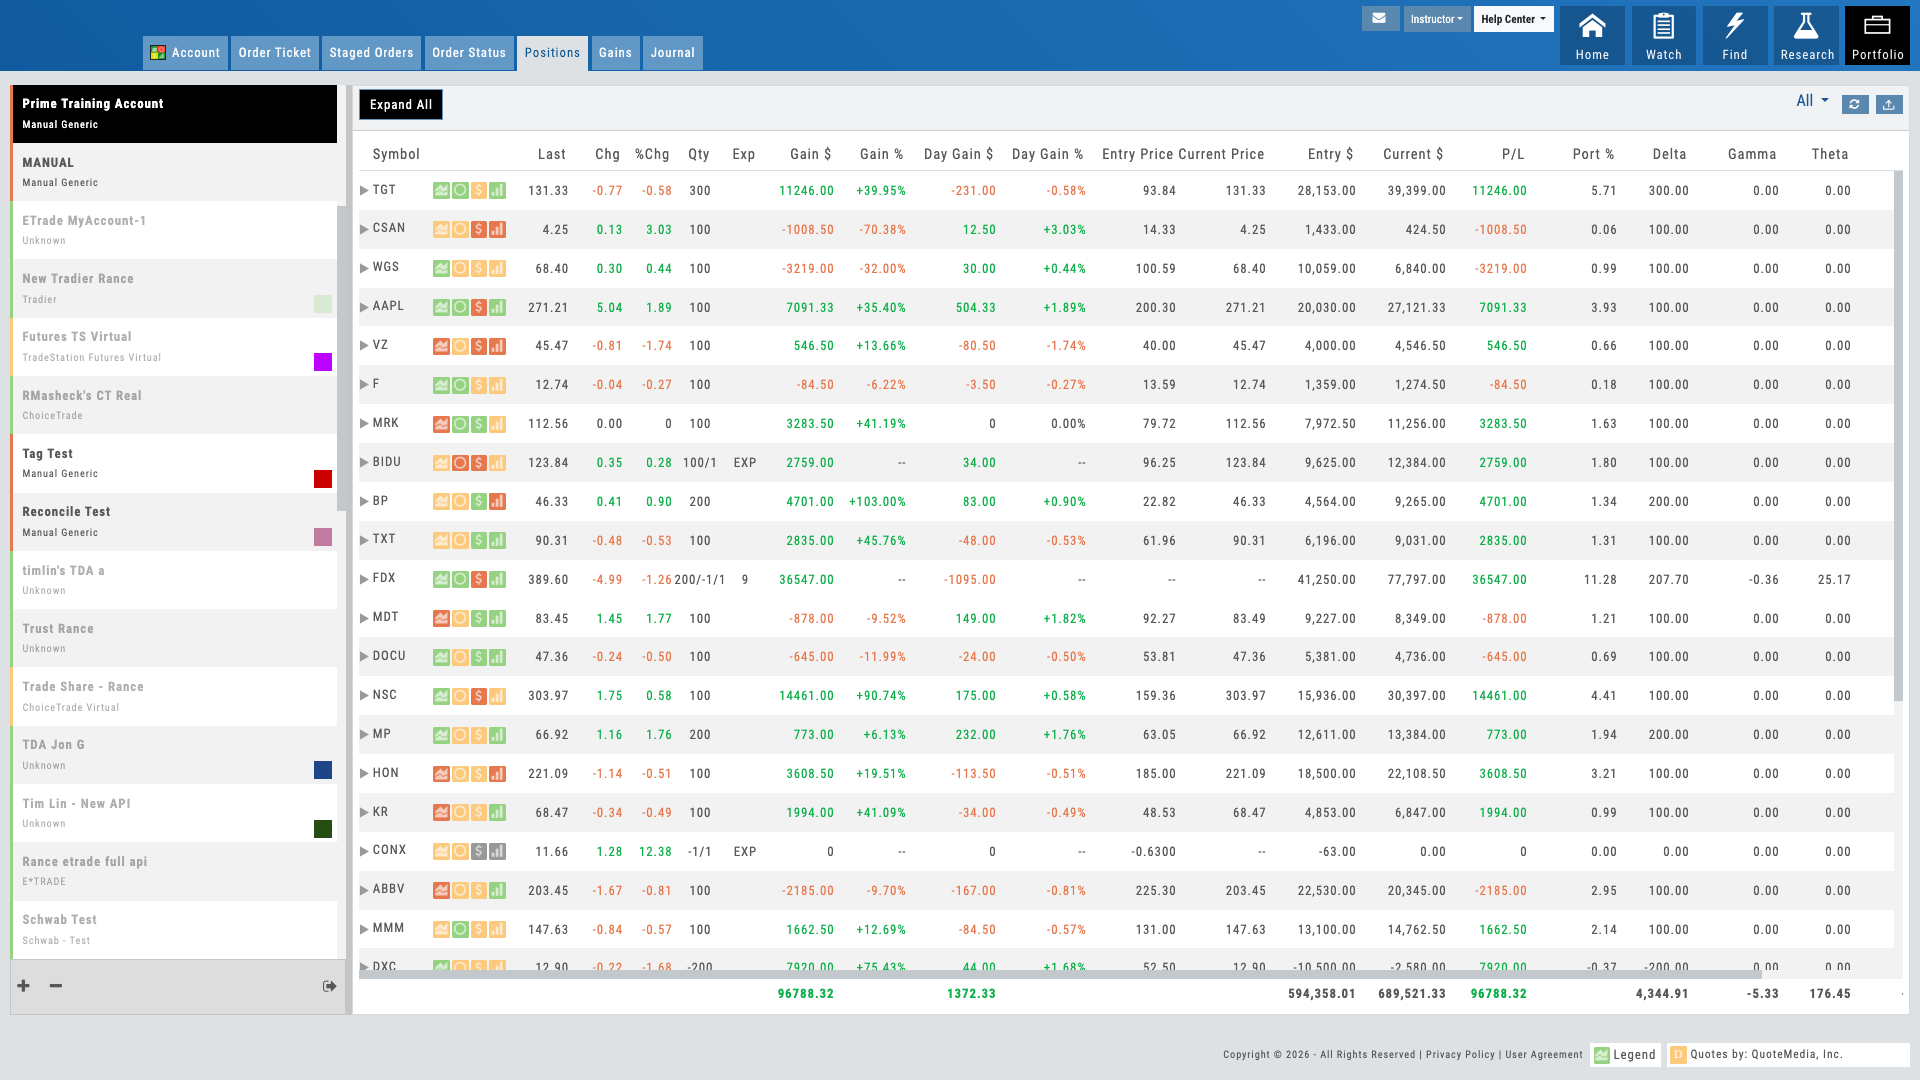
Unified portfolio view showing all accounts and positions at a glance
01 — Multi-Broker Aggregation
See All Accounts in One View
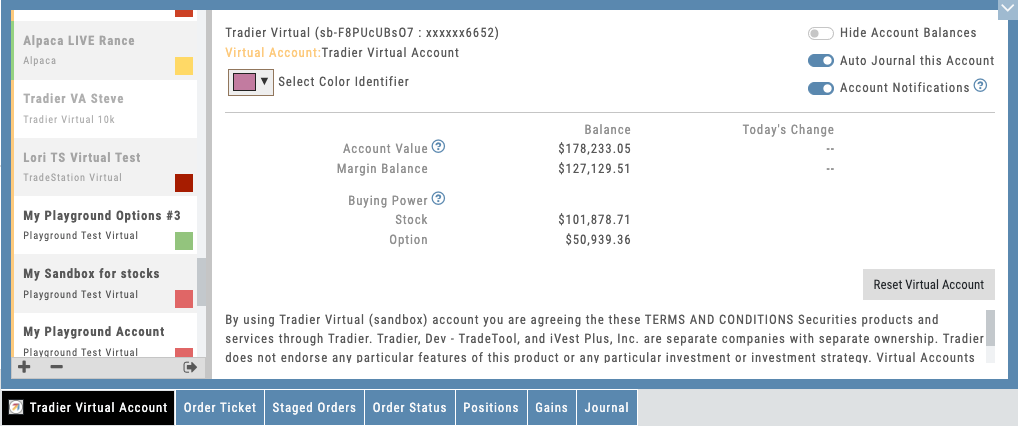
Combine every account — every broker — into one unified portfolio dashboard.
Most traders juggle multiple brokers: one for stocks, another for options, a third for margin accounts. The Portfolio module aggregates all of them. Connect any account and see a consolidated view: total account balances, combined buying power, available margin across all accounts, and every position in one list.
Beyond live accounts, the platform includes a built-in virtual account that’s one of the best in the industry. It handles realistic fills, exercise, assignment, and cash-settled index options — so students learn with the same mechanics they’ll face with real money. This is not simplified paper trading that breaks down on complex strategies.
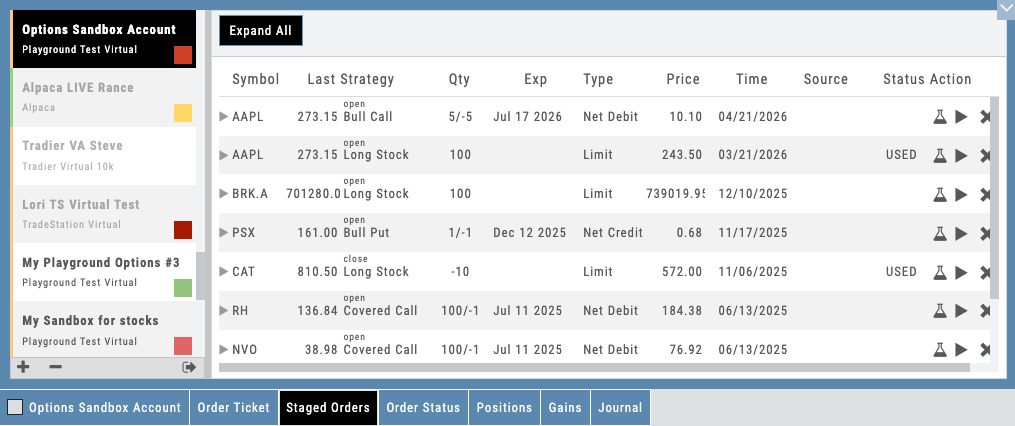
Users can also stage trades for later execution — saving positions from scans, templates, or the chain without submitting to the broker. Staged trades persist across sessions and can be reviewed, modified, and executed when the setup confirms. It’s a workflow discipline tool that teaches patience and planning.
- Connect multiple brokerage accounts to one dashboard
- Built-in virtual account with realistic fills, exercise, and assignment
- Stage trades for later — review and execute when the setup confirms
- Real-time sync across all accounts — no manual refresh required
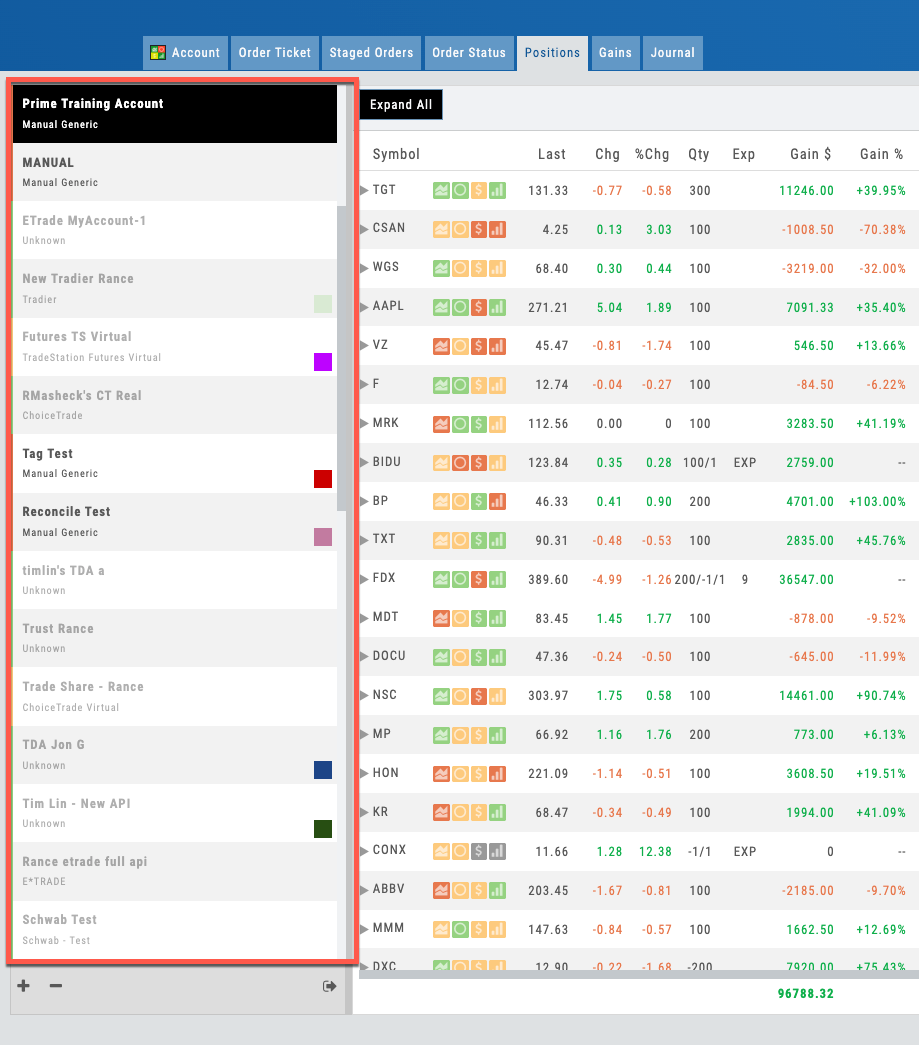
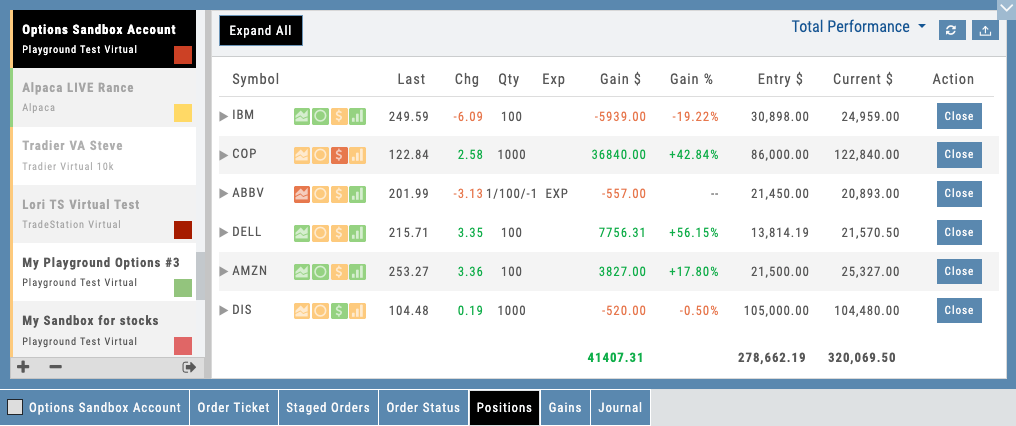
Portfolio dashboard showing positions from multiple connected accounts
02 — Deep Brokerage Integration
Every Day-to-Day Brokerage Action Happens In-App
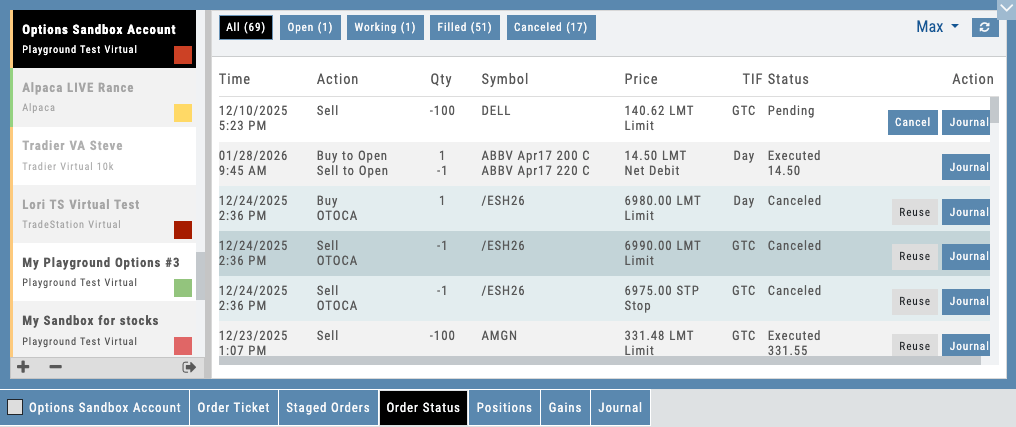
Place, modify, cancel, roll, close, assign, monitor — all inside the platform. The brokerage integration runs deep, not just at the trade ticket.
Most platforms stop at “place a trade.” iVest+ goes deeper. Every routine interaction your users have with their broker — order status, modifications, cancellations, rolls, buy-to-closes, exercise requests, assignment handling, corporate action acknowledgments, dividend tracking, margin alerts — happens inside the platform. No second tab. No bouncing to a clunky broker portal mid-decision.
The only reasons a user ever needs to open their broker’s website: moving money in or out, downloading a statement, or pulling tax documents. Buying power, margin calls, pending order queues, position adjustments, option assignments, splits, dividends — all surfaced live, all managed in-app, all in your brand’s environment.
For B2B partners, this matters two ways. First, your brand stays front and center — students never bounce to a generic broker UI mid-workflow. Second, every brokerage action is logged, tagged, and visible in your reporting. Coaches see exactly what students did with their orders, not just what trades eventually closed.
- Full order lifecycle: entry, modification, cancellation, replace — all in-app
- Exercise, assignment, and early-close handling without leaving the platform
- Option rolls execute as single-ticket close-and-reopen with net pricing
- Live buying power, margin status, and day-trade calls surfaced on every screen
- Corporate actions (splits, dividends, mergers) reconciled automatically in positions
- Every brokerage interaction logged to the Journal with full intent and timing
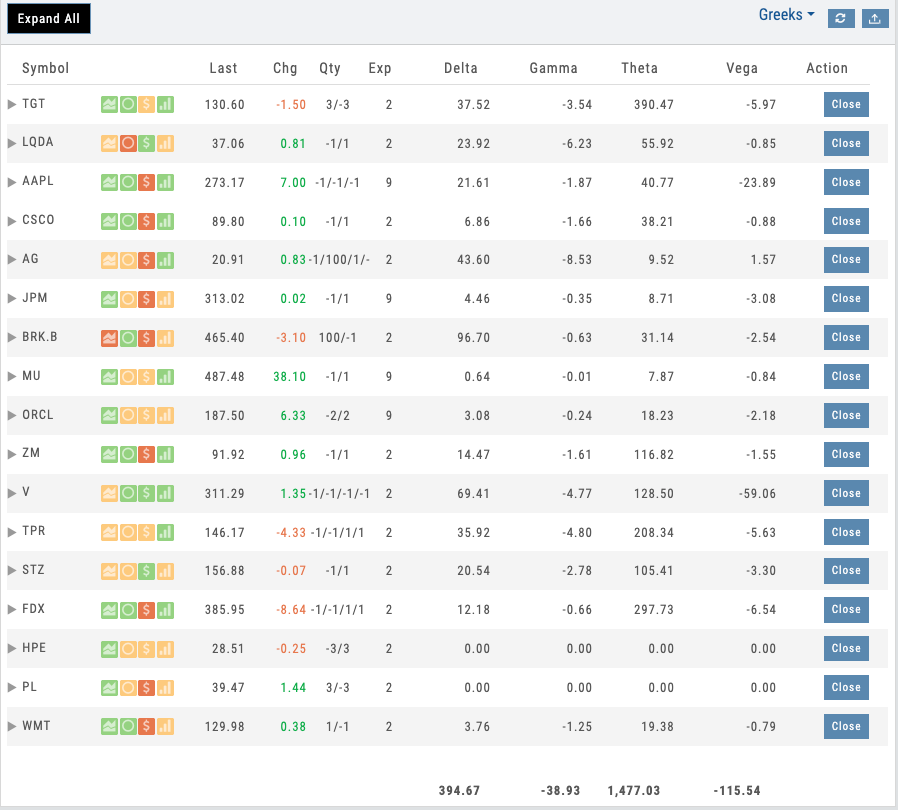
Portfolio Greeks panel showing aggregated Delta, Gamma, Theta, Vega
03 — Portfolio Risk Management
Portfolio Greeks Exposure
Net Delta, Gamma, Theta, and Vega across your entire portfolio — understand total risk at a glance.
Portfolio Greeks aggregate all position Greeks across every holding. Instead of calculating total delta by hand, users see it instantly: how much the portfolio moves if the underlying gains $1, how gamma exposure changes, whether your portfolio is short or long volatility. This is the level of insight institutional traders expect — and it’s critical for teaching risk management.
For educators, portfolio Greeks are a revelation. Students immediately see how adding a new position changes their total exposure. They learn that buying a call and selling two calls doesn’t just affect that one stock — it shifts the entire portfolio’s delta. Greeks make the abstract concept of portfolio-level risk concrete and tangible.
- Aggregated Delta across all positions
- Combined Gamma exposure — see how convexity scales with position changes
- Portfolio Theta — total daily time decay across holdings
- Net Vega — understand volatility sensitivity across your entire book
Want Your Users to See All Their Positions in One Place?
Multi-broker aggregation, unified Greeks, real-time P&L, and one-click trading — deployed as part of your branded platform.
04 — Position Drill-Down
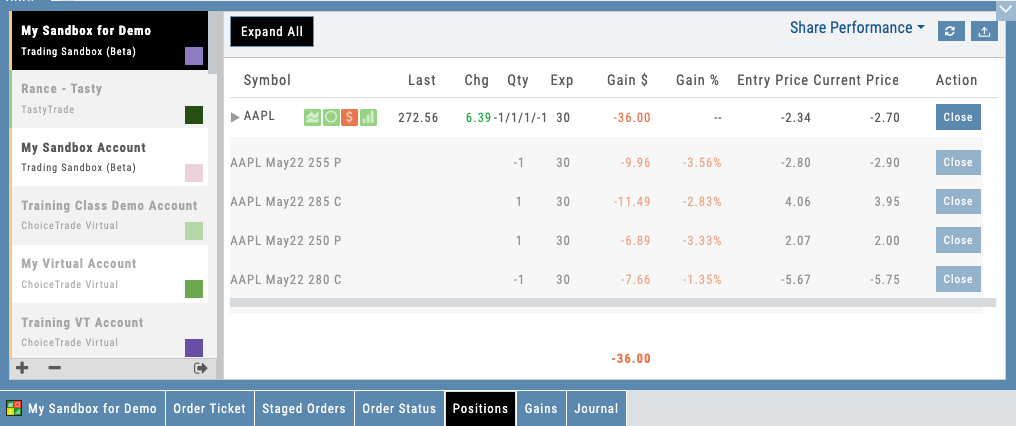
Multi-Leg Options Breakdown
Expand any position to see individual legs, cost basis, current value, and P&L by leg.
Multi-leg options positions are the hardest to track. A call spread, an iron condor, a calendar spread — they’re built from individual legs, but most platforms force users to see them as separate one-leg positions scattered across the portfolio. iVest+ groups them by strategy.
Click on a multi-leg position and see every leg broken out: strike, expiration, quantity, cost basis, current mark, and P&L. The portfolio knows it’s a single trade with two legs, not two unrelated positions. For educators, this is critical: it lets students understand that they built a coherent strategy, not accidentally opened two side bets.
- Multi-leg positions grouped by trade intent, not individual legs
- Each leg shows strike, quantity, cost basis, and current P&L
- Total position P&L aggregates across all legs correctly
- Expand to chart any single leg with full technical context
Cost basis and strike prices appear on every chart automatically
Positions live on the options page — roll, adjust, or add legs without switching views
05 — Platform-Wide Position Awareness
Your Positions, Everywhere You Work
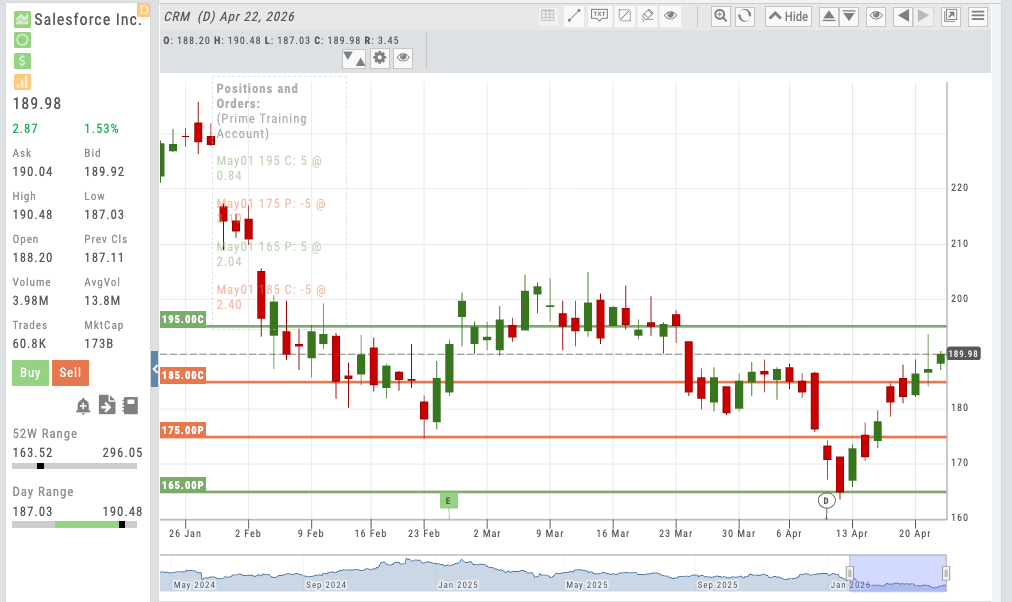
Your positions follow you across the platform — on charts, on the options page, everywhere. Manage trades from wherever you are, not just the portfolio view.
Portfolio management doesn’t live on one page — it’s woven throughout the platform. Open a chart for any stock you own and your cost basis line is already there. If you hold options, your strike prices appear on the chart with long/short indicators. Navigate to the options page and your current position shows automatically — own a stock that’s up and want to sell a call for income? It’s right there. In a covered call that needs to be rolled out? Manage it directly from the options page without switching back to the portfolio view.
Every action flows forward. Execute a trade from the chart or options page and the journal automatically logs the entry with cost basis and intent. The entire workflow is connected — no data re-entry, no manual logging, no navigating back and forth. This is active portfolio management, not just portfolio viewing.
- Charts show your cost basis line for stocks and strike prices for options positions
- Options page displays your current position — manage, roll, or add legs without switching views
- Sell calls against stock positions, roll covered calls, adjust spreads — all from the options page
- Every executed trade flows to the Journal automatically with full context
Unified Portfolio Management, Under Your Brand
Multi-broker aggregation, portfolio Greeks, multi-leg options breakdown, real-time P&L, and positions visible throughout the platform — on charts, on the options page, everywhere your users work. All deployed as part of your branded trading platform. Active portfolio management, not just portfolio viewing.
Connects to leading brokerages for unified portfolio aggregation. See all supported brokers →
Options
Options Module
Deepest Options Analytics with Built-In Guardrails
20 strategy templates that make options easy to understand. Every trade shows max risk, max reward, breakeven, and Greeks — with visual P&L zones right on the chart. Proprietary gauges, IV slider, 25 years of backtesting, and trade management tools. All under your brand.
Options Module
Interactive Guide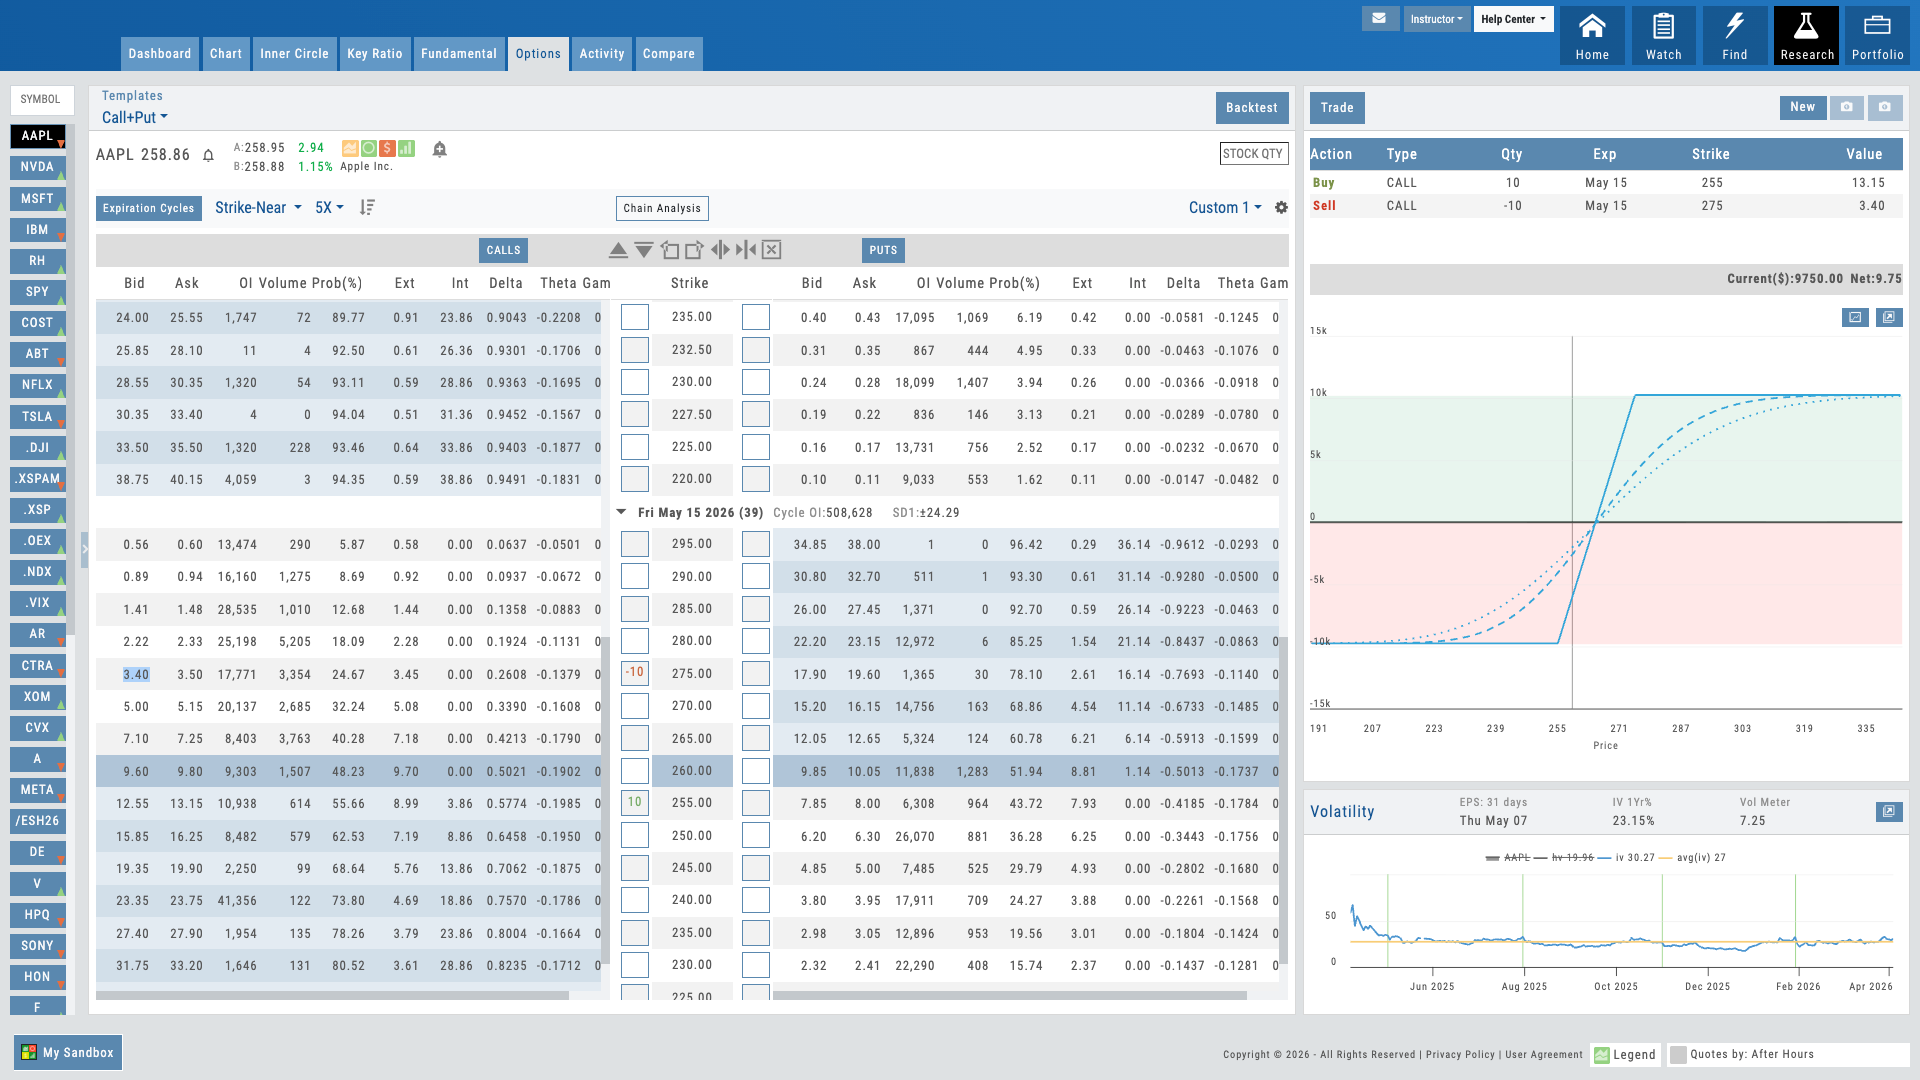
Hover over the pulsing dots to explore features
Options Trade Builder
Interactive Guide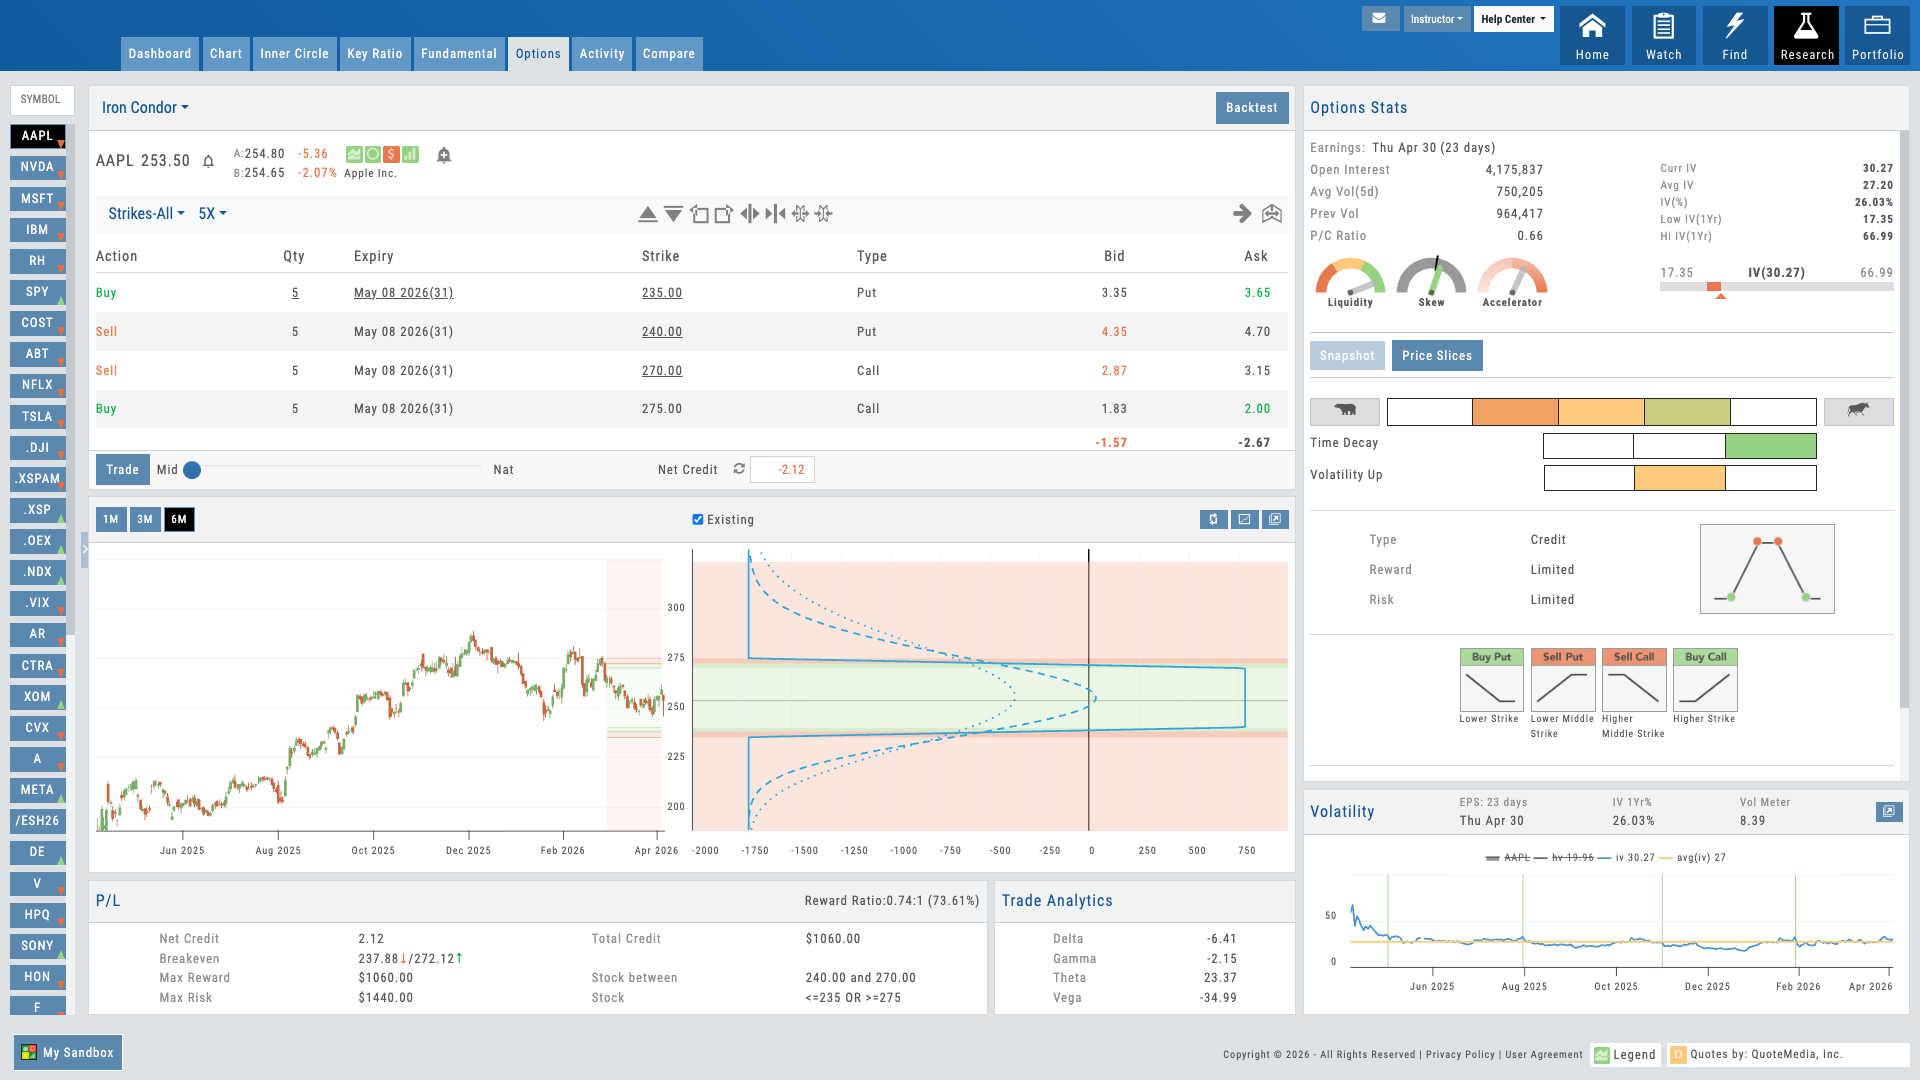
Hover over the pulsing dots to explore the trade builder
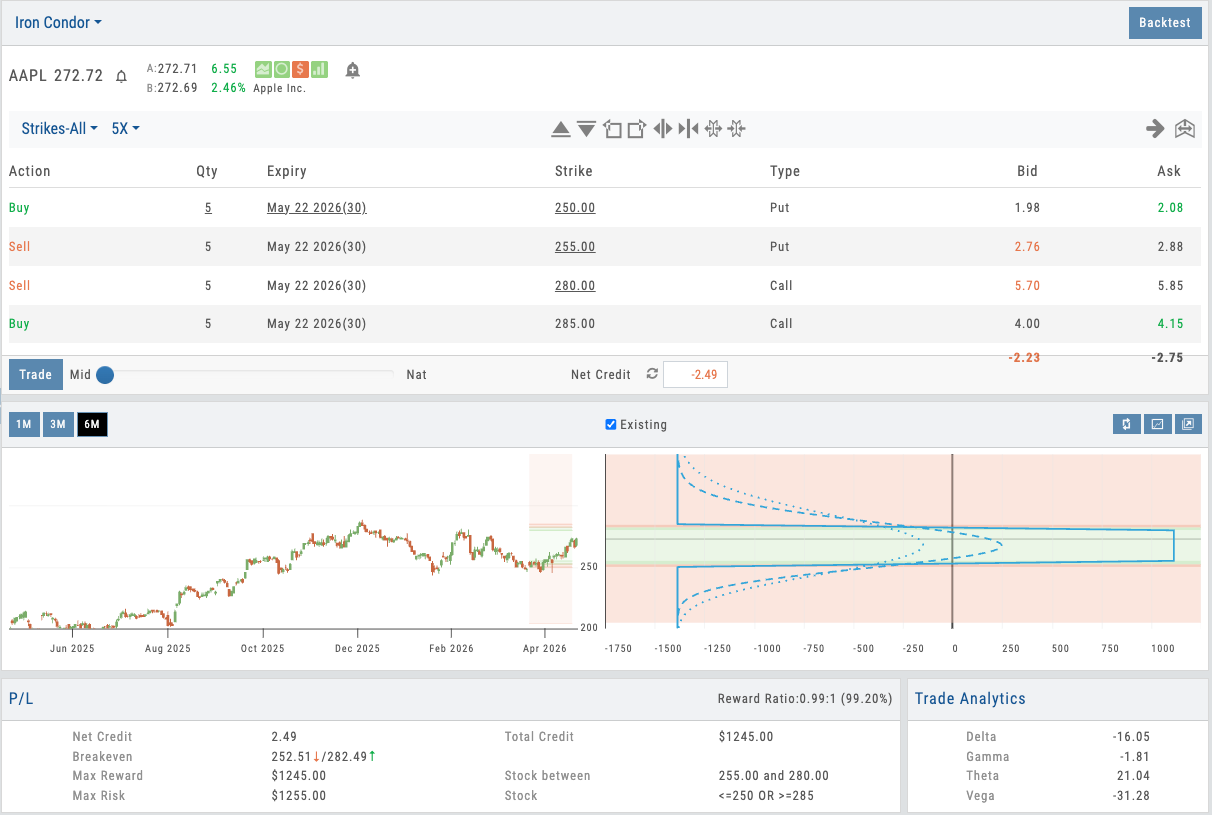
01 — Core Differentiator
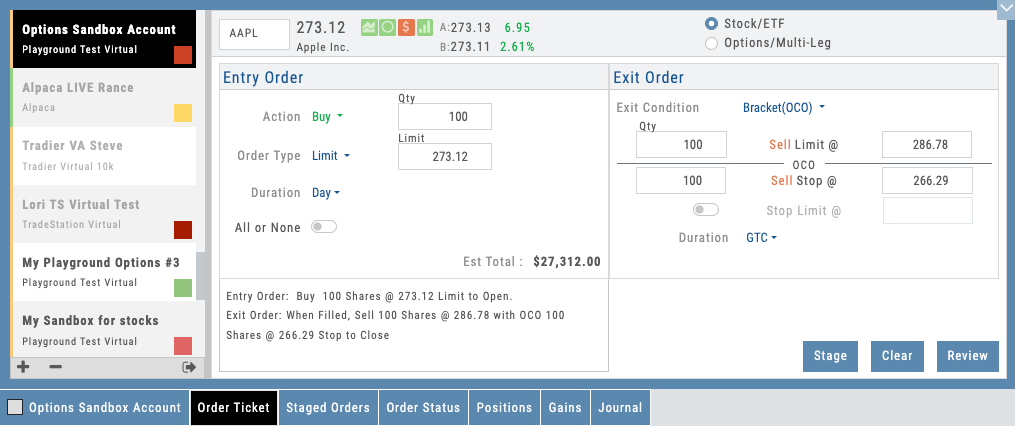
20 Strategy Templates That Make Options Easy
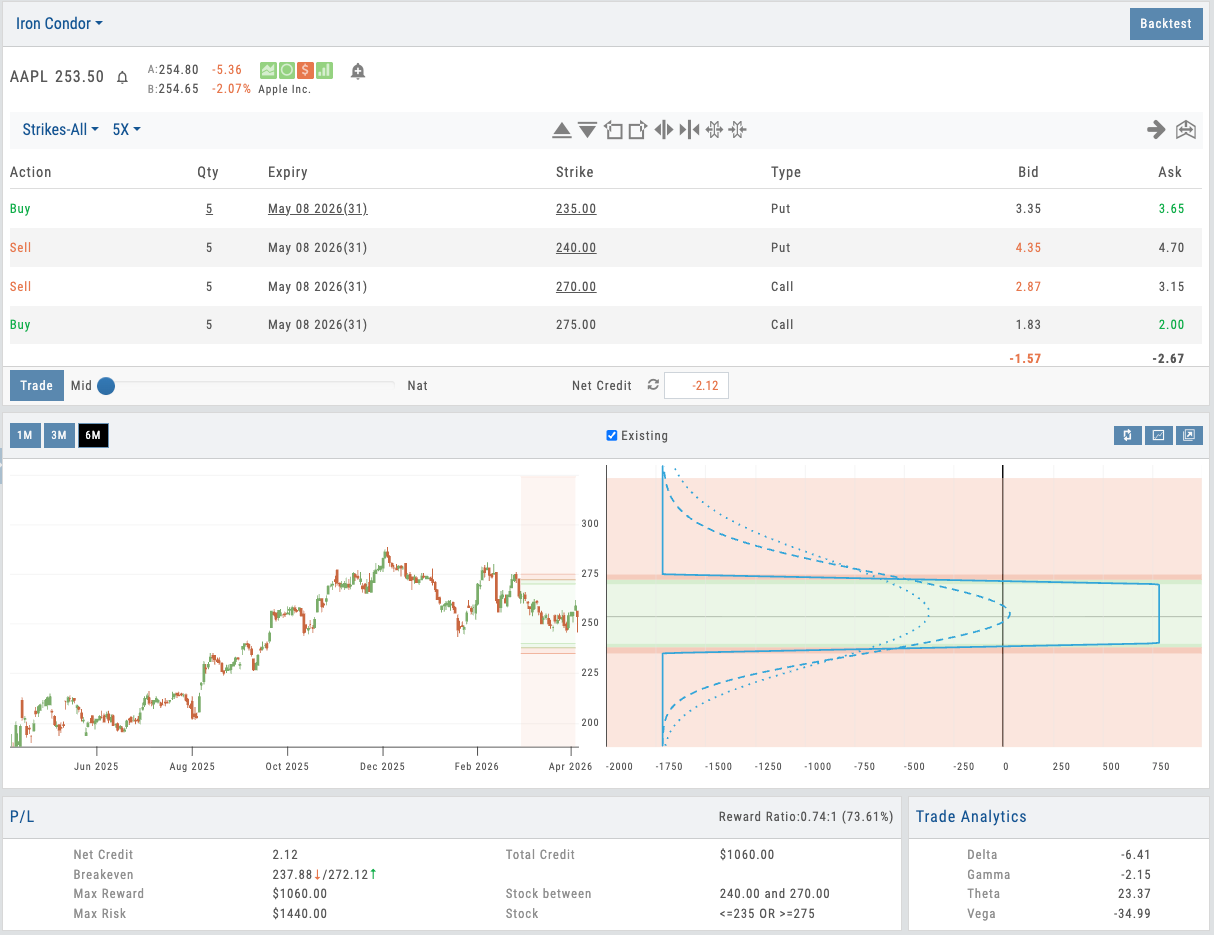
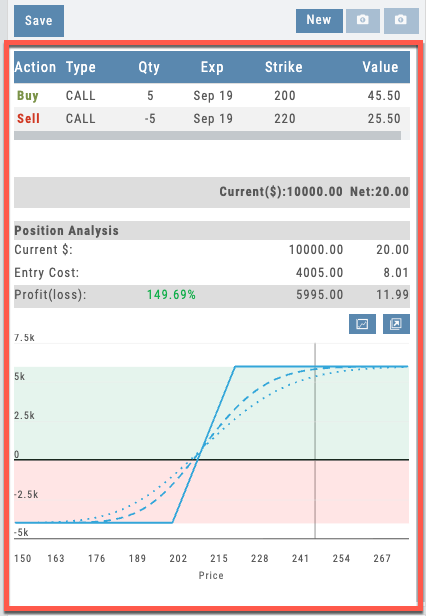
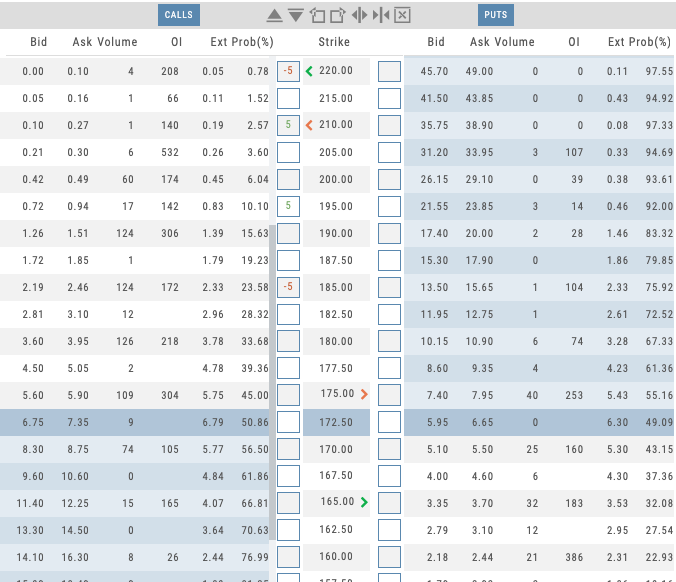
Skip the complexity of the full options chain. Pick a strategy, and everything you need is right there — max risk, max reward, breakeven, risk/reward ratio, net Greeks, and a visual P&L that shows exactly where you make and lose money.
Options chains are overwhelming. Hundreds of strikes, multiple expirations, and it takes real expertise to know which legs to combine. iVest+ strategy templates cut through that complexity. Pick a strategy — bull call spread, iron condor, collar, straddle — and the template builds the trade for you. You’re immediately in the strategy you selected, no guesswork required.
Everything a trader needs to evaluate the trade is right on the screen. Max risk, max reward, breakeven points, risk/reward ratio, and net Greeks — delta, gamma, theta, vega — all calculated instantly. The P&L chart shows profit and loss zones in color directly on the price chart, so users see at a glance where the trade makes money, where it loses, and where the breakevens fall. No mental math. No spreadsheet on the side.
Built-in guardrails make it impossible to misconfigure. Dates sync automatically, quantities lock relative to each other, and strikes are restricted to valid combinations. Students can’t accidentally build an invalid trade. Institutions get zero malformed orders reaching the broker.
For educators, this changes how options are taught. Students focus on strategy logic — why this spread at this width — instead of fighting order mechanics. For traders evaluating a position, every number they need is already calculated and visual. Pick the template, read the risk, place the trade.
- 20 strategy templates — pick a strategy and the trade builds itself, no chain required
- Max risk, max reward, breakeven, risk/reward ratio, and net Greeks all calculated instantly
- P&L zones shown in color on the chart — see profit and risk areas at a glance
- Built-in guardrails prevent invalid trades — zero malformed orders reach the broker
Click to enlarge
Bull call spread with P&L zones, breakeven, max risk/reward, and Greeks — all on one screen
Three gauges displayed: Accelerator (green), Skew (yellow), Liquidity (multicolor 5-factor)
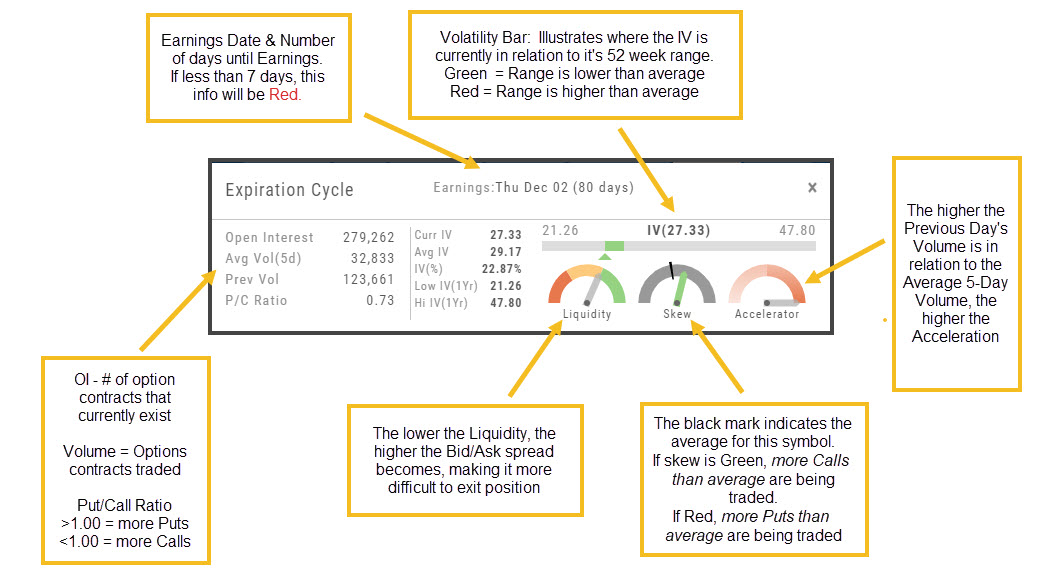
02 — Proprietary Intelligence
3 Proprietary Gauges
Momentum, volatility skew, and multi-leg liquidity — metrics built on 25 years of options data and unavailable anywhere else.
The Accelerator gauge measures short-term momentum and momentum exhaustion — essential for timing option entries before volatility spikes. The Skew gauge reads the options market’s view of future volatility distribution — critical for spread traders to know if skew is stretched or depressed.
But the Liquidity gauge is the real secret. While competitors offer bid-ask spreads, iVest+ calculates a comprehensive 5-factor liquidity score that accounts for depth, width, tightness, fill probability, and execution cost across all legs. For multi-leg positions, no other platform gives you this visibility into actual tradability before you commit.
All three gauges are also available on the Research module’s detail pages — giving your traders institutional-grade analysis under one cohesive brand experience.
- Accelerator — momentum and exhaustion timing for entry decisions
- Skew — volatility distribution for spread strategy positioning
- Liquidity — 5-factor tradability score for multi-leg orders
- All three gauges are proprietary and unique to iVest+
03 — Scenario Analysis
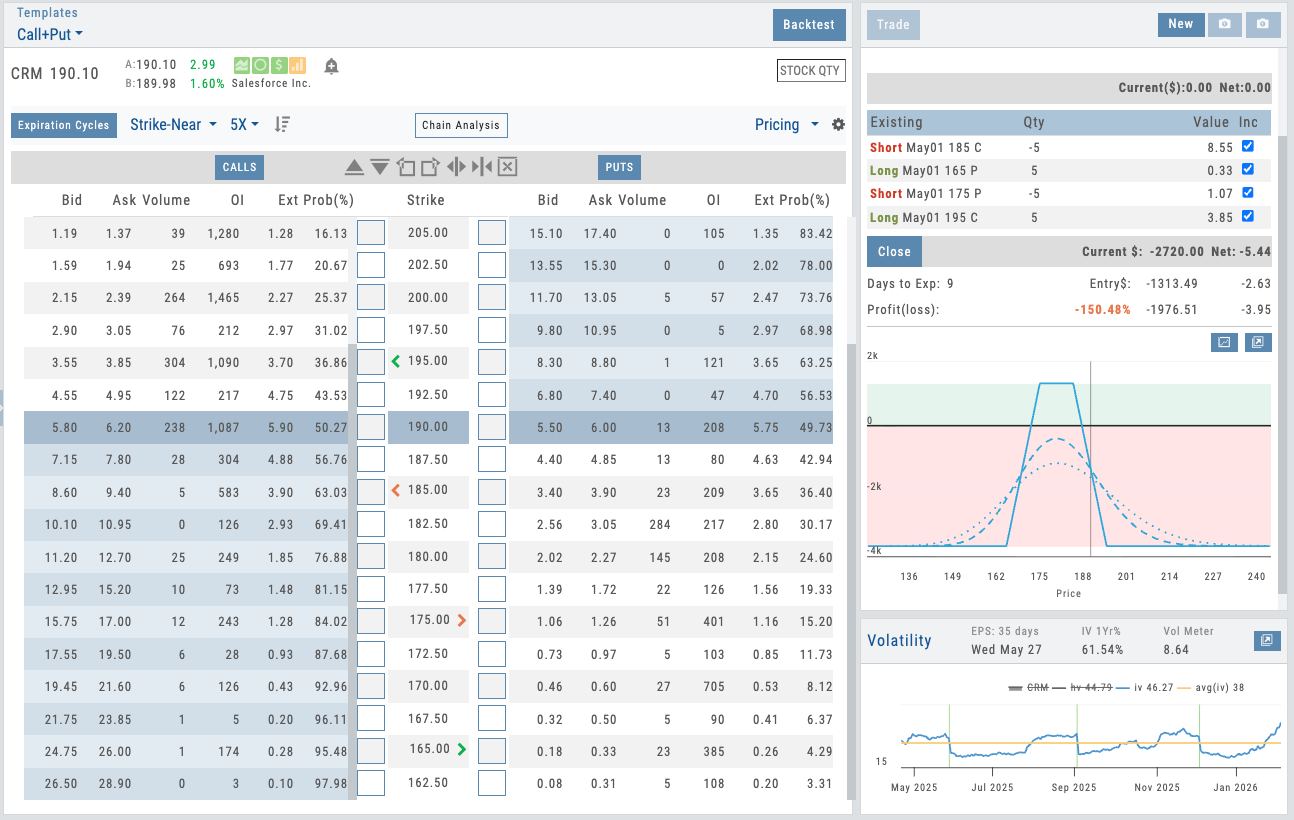
See What Any Scenario Does to Your Trade
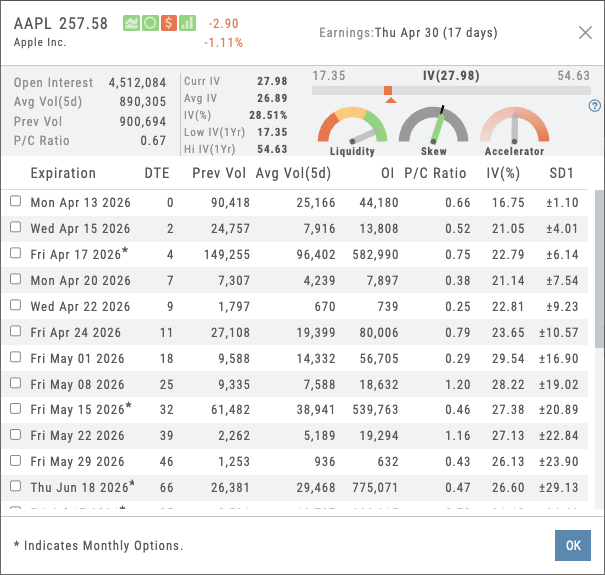
Model any scenario before you commit. Drag the IV slider to see volatility impact, or use Price Slices to see exactly what your trade is worth at any price on any date.
Option traders live and die by implied volatility. A straddle bought at 52% IV that drops to 41% post-earnings can turn a $300 loss into a $1,200 loss — but most platforms force you to imagine that outcome. iVest+ shows it. Drag the IV slider up or down from the current level, and a dotted line appears on the risk graph showing the projected position value at the adjusted IV. You see exactly what happens to your P&L if volatility rises, collapses, or stays flat.
Price Slices take it further. Set any price point — by entering a value, a percentage offset, or simply dragging a line on the chart — and see the theoretical P&L, position value, and Greeks at that exact price. Set the date you want to analyze, and the calculation adjusts for time decay. Add multiple lines for deeper analysis: what does the trade look like at the current price, at your target, and at your stop? All three answers are on the screen at once.
For educators, students stop guessing about vega and theta — they see them. Move the IV slider to understand why selling premium into high IV works. Drag a Price Slice to next Friday and watch theta eat into the position. For traders, it’s the fastest way to answer “what’s this trade worth if the stock hits X by Y date?” — no spreadsheet required.
- IV Slider projects position value at any volatility level on the risk graph
- Price Slices show theoretical P&L, value, and Greeks at any price and date
- Enter a price, percentage offset, or drag lines directly on the chart
- Add multiple price lines for side-by-side scenario comparison
Click to enlarge
Click to enlarge
Price Slices with draggable lines showing theoretical P&L at multiple price targets alongside the IV slider
Want to Offer Institutional-Grade Options Analytics Under Your Brand?
20 strategy templates, proprietary gauges, dynamic risk analysis, and 25 years of backtesting — deployed as part of your branded platform.
Options chain with strategy template selector and one-click leg placement
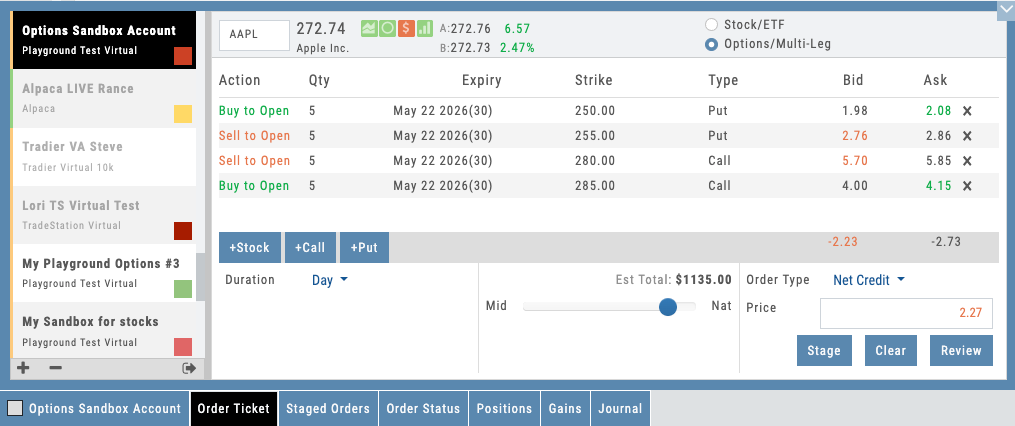
04 — Direct Execution
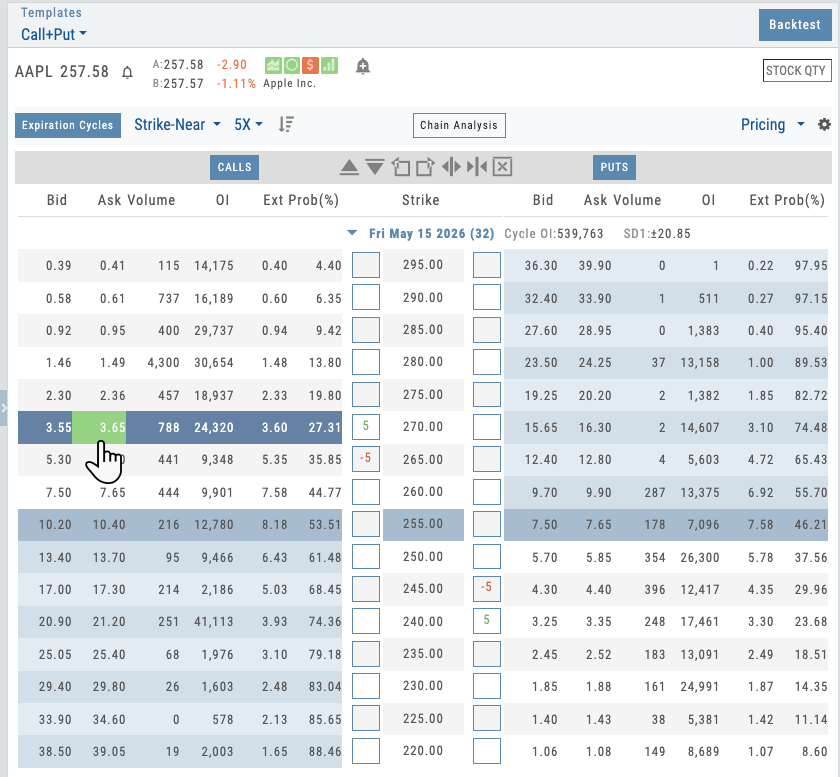
Trade Directly from the Chain
Select a strategy template from the chain. Watch it auto-populate with one-click leg placement. Then refine and send.
The options chain is how traders think. They scroll through strikes, they see the data, they build. iVest+ bridges the gap between chain analysis and strategy building.
Select a Butterfly Spread from the template menu on the chain. The template is applied to the selected call. One click on the 50 Delta call, one click on the 40 Delta call, one click on the 30 Delta call, and your Butterfly is built with the right structure, right spacing, and right quantities. No manual configuration. No back-and-forth. The trade matches exactly what the template says it should be.
Refine quantities, adjust prices, change dates if needed — the guardrails keep everything valid. When you’re ready, use the price negotiation slider to adjust your limit price within the bid-ask spread — typically 25–30% off the spread toward the midpoint gives you better fills without chasing. Then send to the broker, or stage it for later.
Not ready to execute? Stage the trade. Staged orders save your position for later without submitting to the broker. Stage from scans, templates, or the chain. Come back later, review, modify, and execute when the setup confirms. Staged trades persist across sessions — nothing gets lost. And for students learning the process, our built-in virtual account lets them practice the entire workflow with realistic fills, including exercise, assignment, and cash-settled index options — the most realistic paper trading available.
- Select strategy template directly from the chain — one-click leg placement
- Price negotiation slider for better fills within the bid-ask spread
- Stage trades for later — review and execute when the setup confirms
- Built-in virtual account with realistic fills, exercise, and assignment
05 — Deep History
25 Years of Daily Options Backtesting
Step through any day since 1999 and watch Greeks evolve in real time. See how your strategy would have performed under any market condition in 25 years.
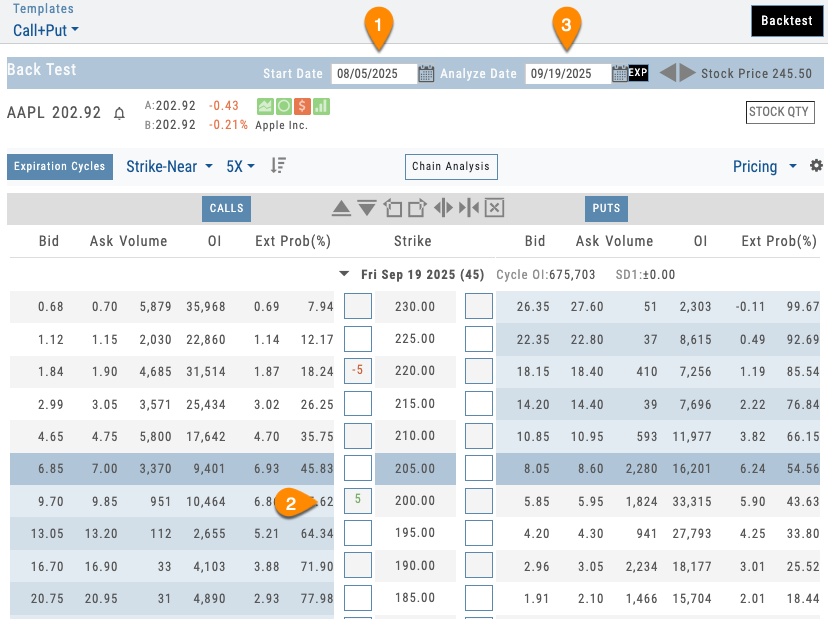
Options backtesting as easy as 1, 2, 3.
- Select the Start Date
- Setup Your Trade
- Select the Analyze Date
See the Results
Backtesting options is harder than backtesting stocks. Greeks change every day. Volatility shifts. Decay happens. Most platforms offer point-in-time results. iVest+ gives you day-by-day stepping.
Select a strategy. Set an entry date. Then step forward one day at a time and watch how the position evolves. See the Greeks on day 1, day 2, day 15. Watch gamma compress, vega shift, theta decay. Plug in historical prices and watch the P&L surface update. This isn’t looking at a line chart — it’s actually living through the trade, day by day.
For educators, this is revolutionary. Students understand options by experiencing them in minutes vs weeks or months. For traders testing strategies, this is the difference between a theoretical backtest and actually knowing what would happen. And because you can test any date since 1999, you can test strategies across the 2008 crisis, 2020 pandemic, 2022 rate shock, and dozens of other market regimes in living color.
- Daily stepping from 1999 to present for any strategy
- Watch Greeks and P&L change in real time as you advance
- Test across different market regimes (2008, 2020, 2022, etc.)
- Full decay, volatility, and price history embedded
Daily stepping interface showing historical date picker and day-by-day Greeks evolution
Three candidate trades with color-coded tables and overlaid P&L curves on a single risk graph
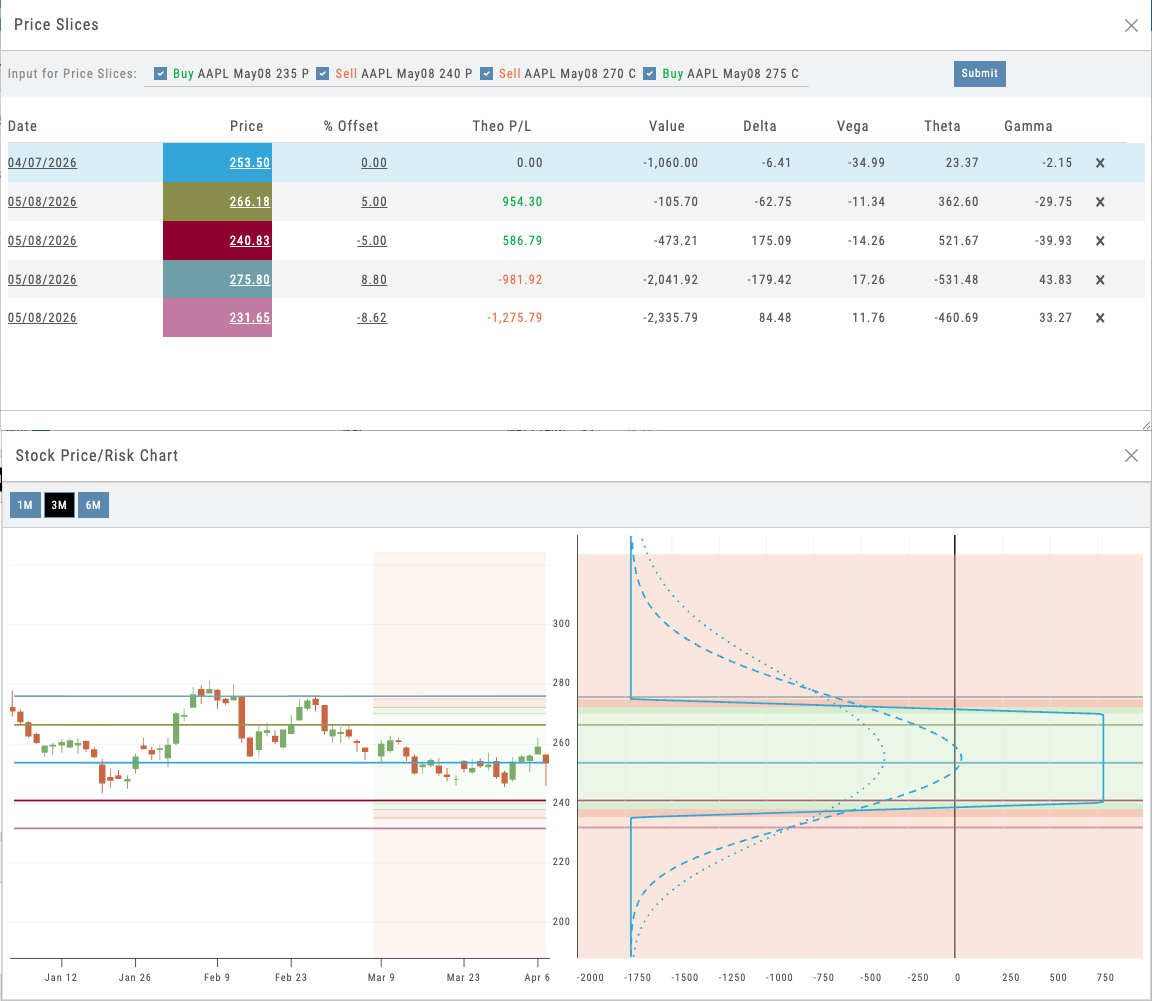
Side-by-Side Decision
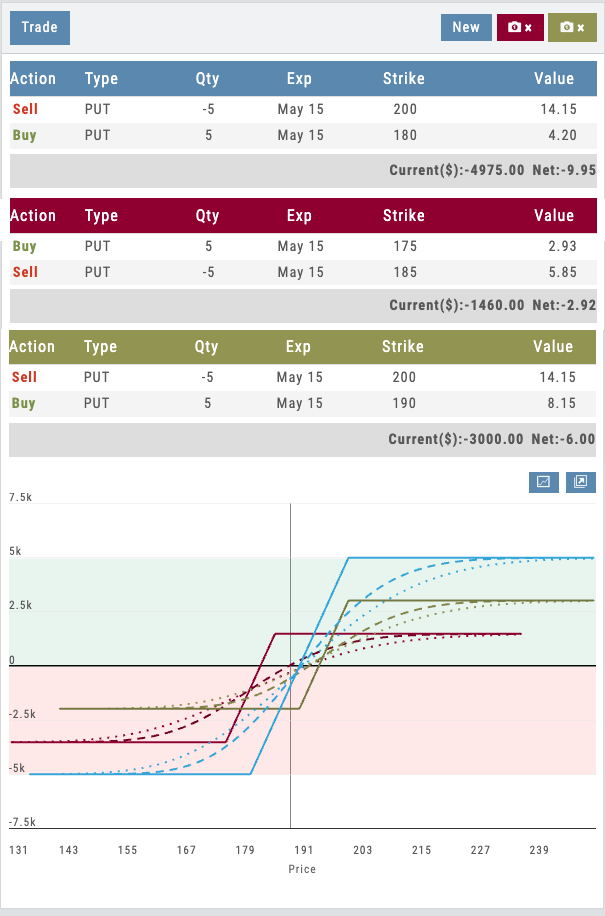
Three Trades. One Decision.
Compare up to three trade variations on a single risk graph. See the cost, strikes, and P&L curves of every candidate at once — then pick the one that fits your outcome.
Most platforms force you to build a trade, study it, tear it down, build the next one, and try to remember what the first one looked like. iVest+ keeps all three live. The tables stack, the risk curves overlay in matching colors, and the current P&L updates for each.
Wider spread for more credit, or tighter for higher probability? You’re not guessing — you’re comparing. When you see the one you want, click it and hit Trade. It’s the simplest way to compare and take action in a single screen.
- Three positions live on one chart
- Color-coded tables tied to color-coded P&L curves
- Adjust strikes, widen/narrow spreads, change quantity — curves update instantly
- Click your choice and Trade — no rebuilding, no re-entering
Take It With You
Pop It Out. Decide With the Full Chart Open.
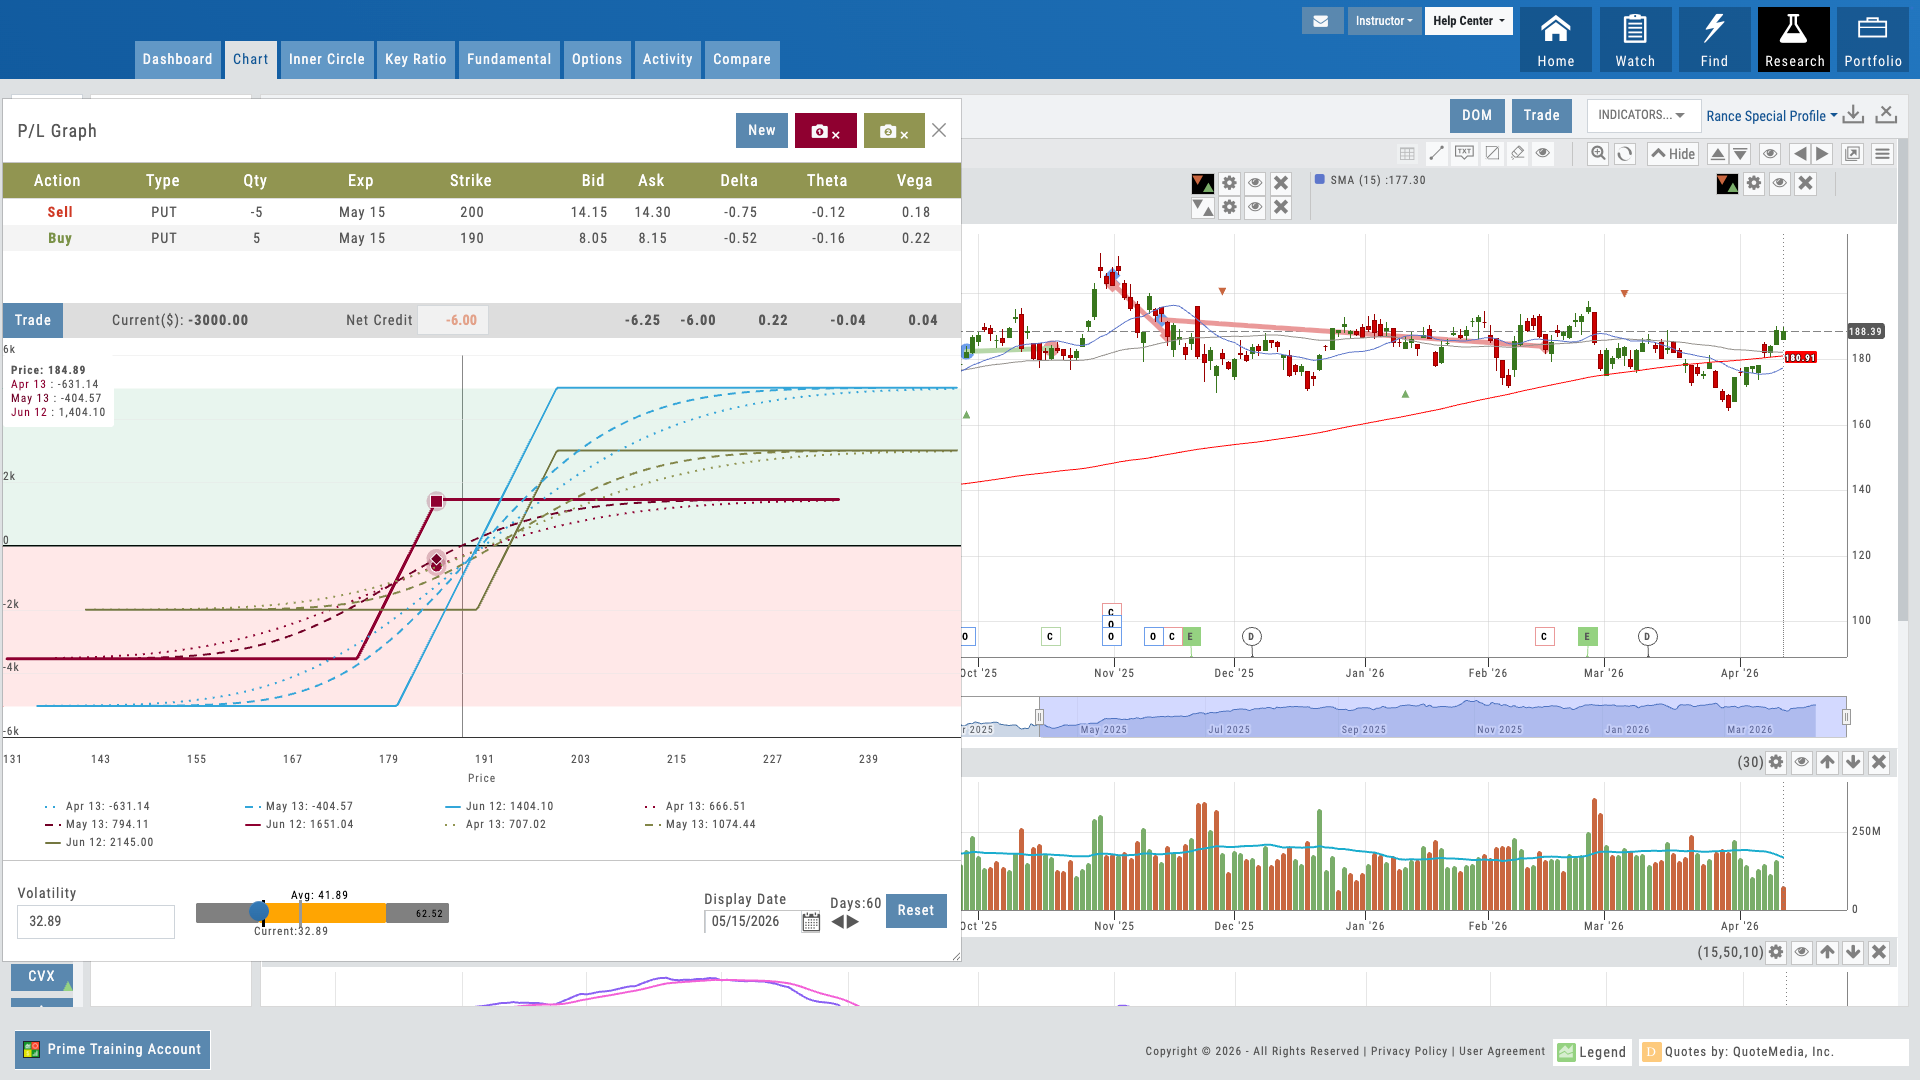
Detach the P&L panel and navigate anywhere in the platform — charts, indicators, fundamentals, heatmap — while your position stays visible.
Most platforms force you to choose: analyze the trade or study the chart. iVest+ gives you both at once. Pop out the P&L graph and move it to any monitor or tab — see your position alongside the daily chart, moving averages, volume, RSI, and support/resistance levels, all live at the same time.
When you use the rolling icons to shift a strike or roll an expiration, you watch the risk curve update while staring at the exact price level you’re rolling to. Decision-making with the trade and the technicals in the same field of view.
- Detach P&L panel and keep it on screen while navigating the app
- Analyze the options position next to full technical charts
- Roll strikes or expirations with the rolling icons — watch P&L update live
- No alt-tab, no memorizing levels, no rebuilding
P&L panel floating alongside a full chart with moving averages, volume, and indicators
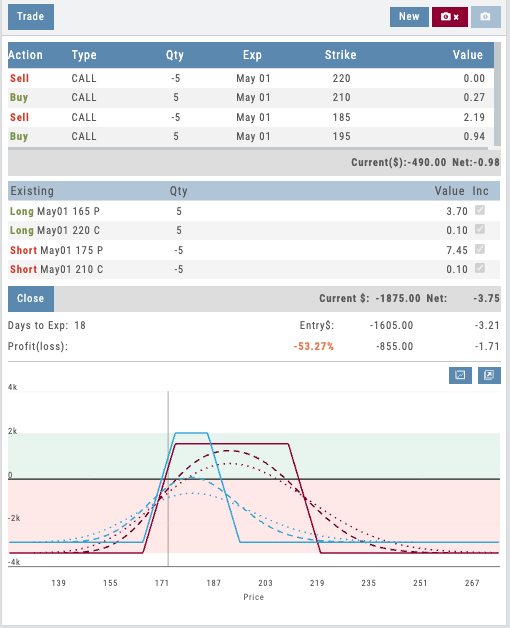
Current position vs. adjusted position displayed side by side on the risk graph
06 — Trade Management
Manage and Adjust Live Trades
See your current positions on the risk graph, build any adjustment, and instantly compare the current trade against the adjusted version — all before you commit.
Options trading doesn’t end when the trade is placed — managing positions is where the real skill lives. iVest+ shows your current position directly on the risk graph so you can see exactly where you stand: your breakevens, max risk, max reward, and how the position performs across price and time.
From there, create any adjustment — roll a short call out and up, add a protective put, convert a vertical into a butterfly — and instantly see a side-by-side comparison of your current trade versus the adjusted version. Both risk profiles display together so you can evaluate the trade-off before committing a single dollar.
For educators, this is where theory becomes practice. Students see how rolling a covered call changes the risk profile in real time. For traders, it eliminates guesswork — you know exactly what the adjustment does to your Greeks, your breakevens, and your max risk before you execute.
- Current positions displayed on the risk graph with breakevens and max risk
- Create any adjustment and compare current vs. adjusted side by side
- See how rolls, additions, and leg changes affect Greeks and breakevens
- Evaluate the full trade-off before executing — no guesswork
Deepest Options Analytics, Under Your Name
20 strategy templates with guardrails, three proprietary gauges, dynamic P&L with IV slider, trade from chain, 25 years of backtesting, and multi-position comparison — all deployed as part of your branded platform. Your users get institutional-grade options analytics. You get a value layer that drives retention and positions you as the serious option for serious traders.
Connects to leading brokerages including Schwab, Tradier, and more. See all supported brokers →
Journal
Journal Module
Every Trade Analyzed Automatically
Automatic leg-level trade matching. 80+ strategy identification. 25+ performance reports. Life-of-trade tracking. AI-powered analysis. All without manual journaling — and all under your brand. Every trade becomes a coaching opportunity.
The Journal
Interactive Guide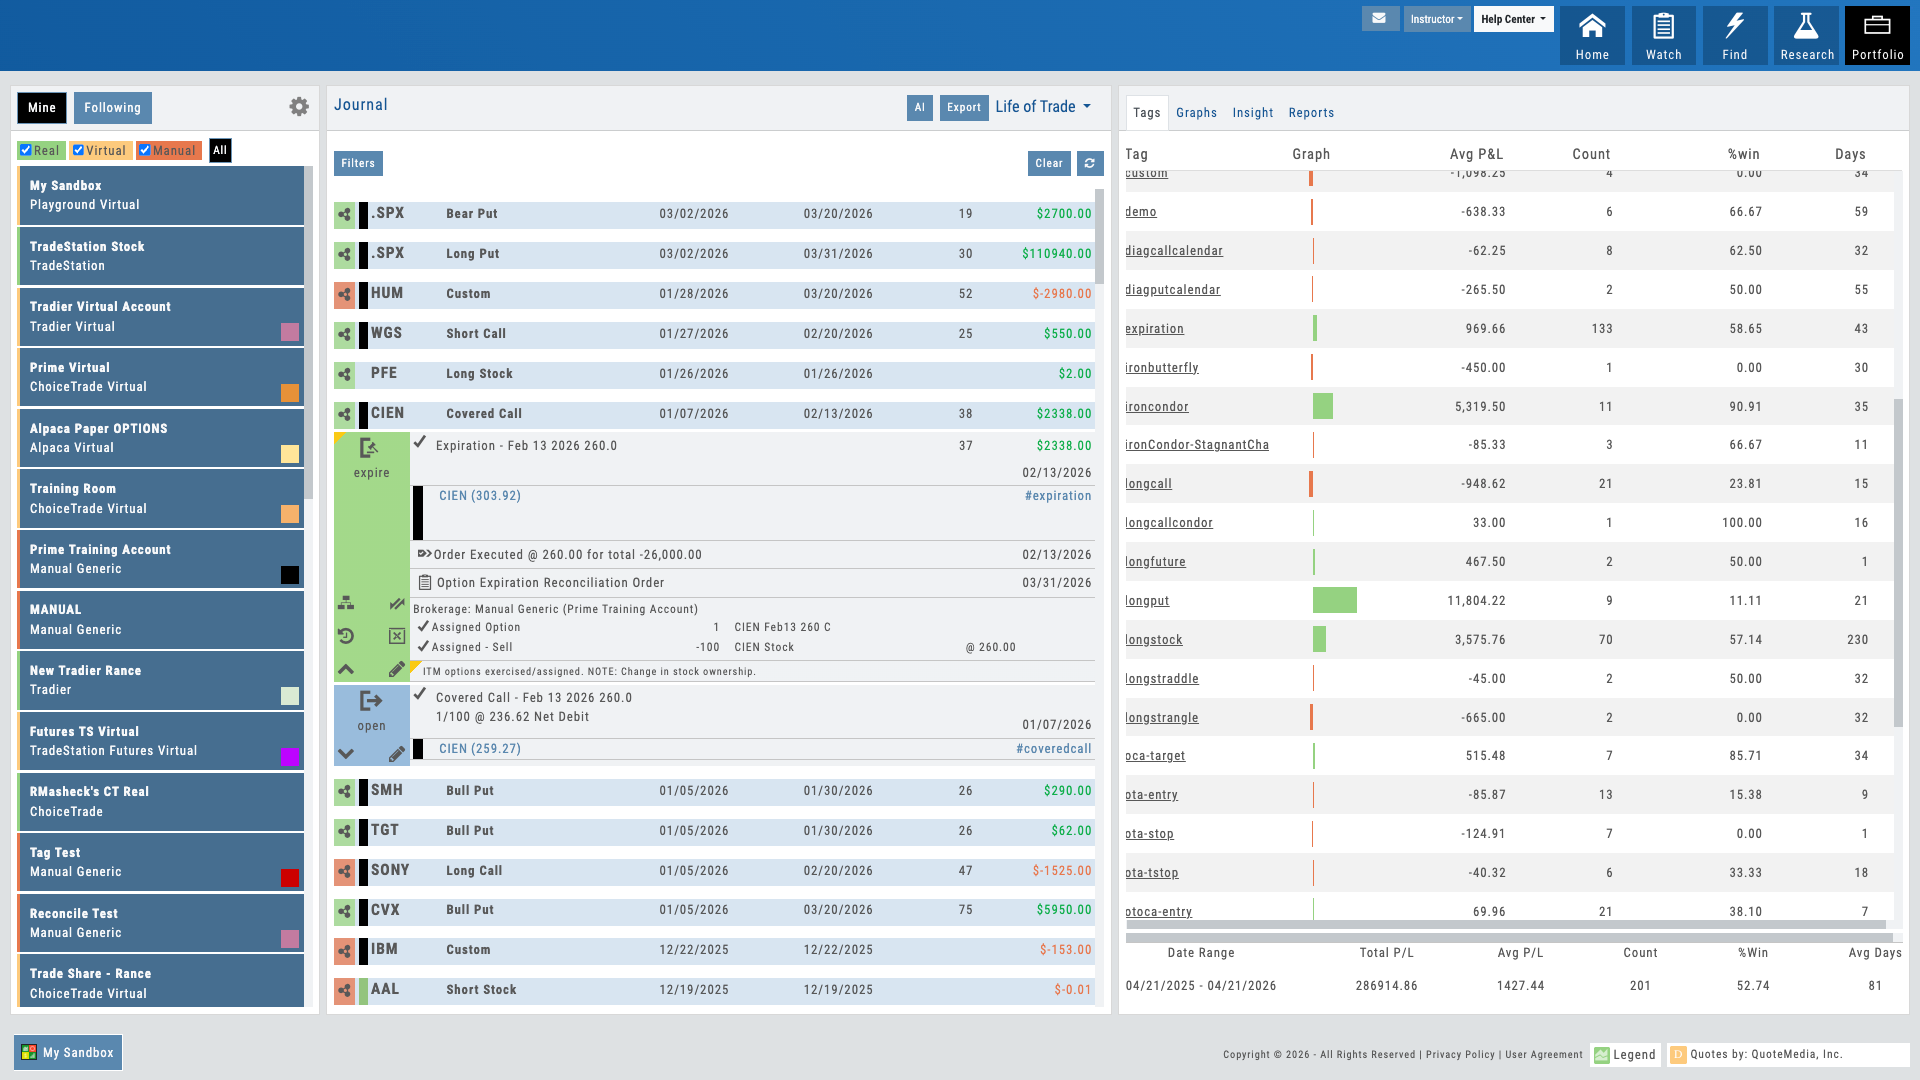
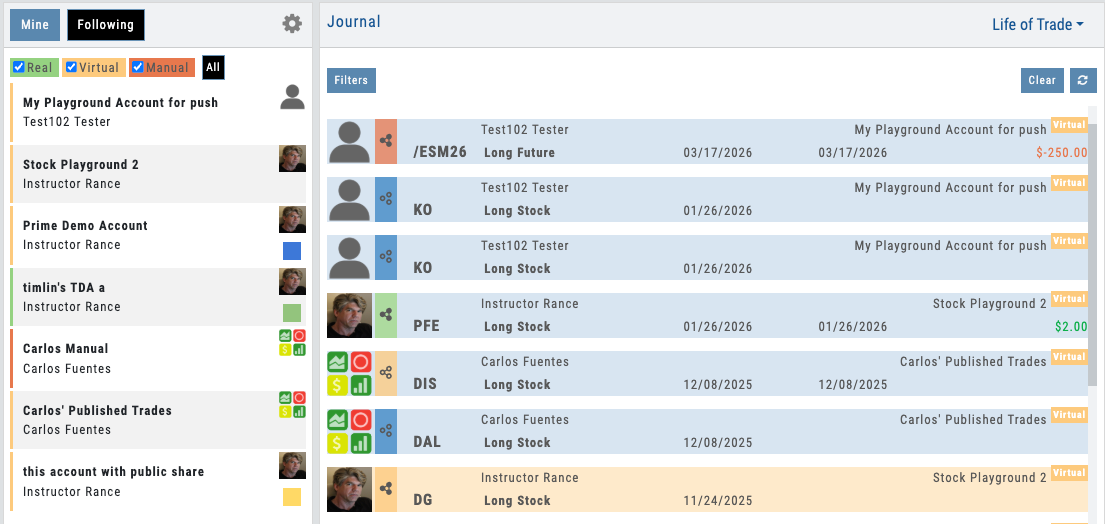
Trade journal with auto-tagged strategies and life-of-trade timeline
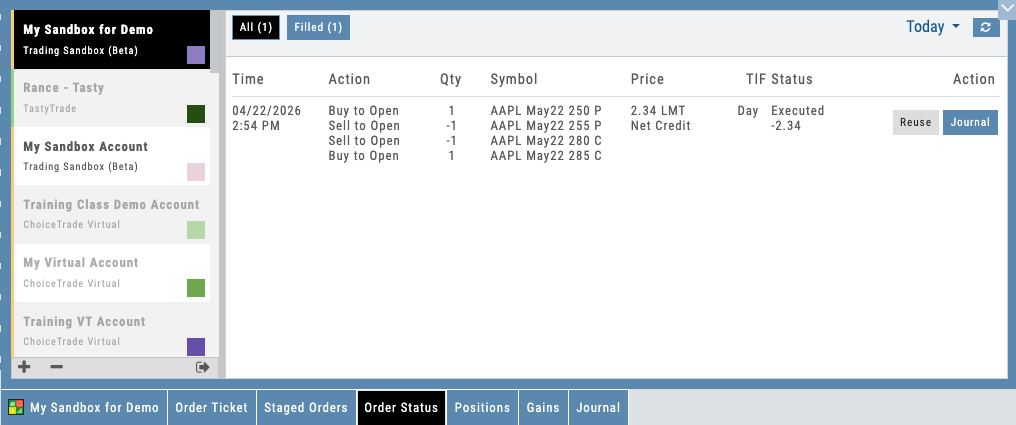
01 — Core Differentiator
Automatic Strategy Identification
The platform matches option legs automatically. 80+ strategies recognized — no manual tagging required.
Most traders log their trades manually: enter the underlying, record the entry price, note the strategy type. Most platforms do nothing with this data except store it. iVest+ is different.
The moment a multi-leg trade is imported, the platform analyzes the strike prices, expiration dates, and leg types, then matches them against 80+ known option strategies — iron condors, vertical spreads, butterflies, diagonals, straddles, collars, and dozens more. Each trade is instantly tagged with a strategy ID. No student confusion. No manual miscategorization. The journal knows what was actually traded.
For educators, this is transformative. You no longer have to correct students’ trade logs or spend time managing tags. The platform enforces accuracy at the point of entry. Your students focus on learning; the system handles classification.
- 80+ option strategies automatically recognized (iron condor, vertical spread, butterfly, diagonal, straddle, collar, etc.)
- Multi-leg trades tagged instantly at import — no manual entry required
- Strategy ID assigned and searchable across all student accounts
- Eliminates miscategorization and manual review of trade logs
Multi-leg trade auto-tagged with strategy ID and leg breakdown
Trade timeline showing open, adjustments, rolls, and close with P&L at each step
02 — Coaching Catalyst
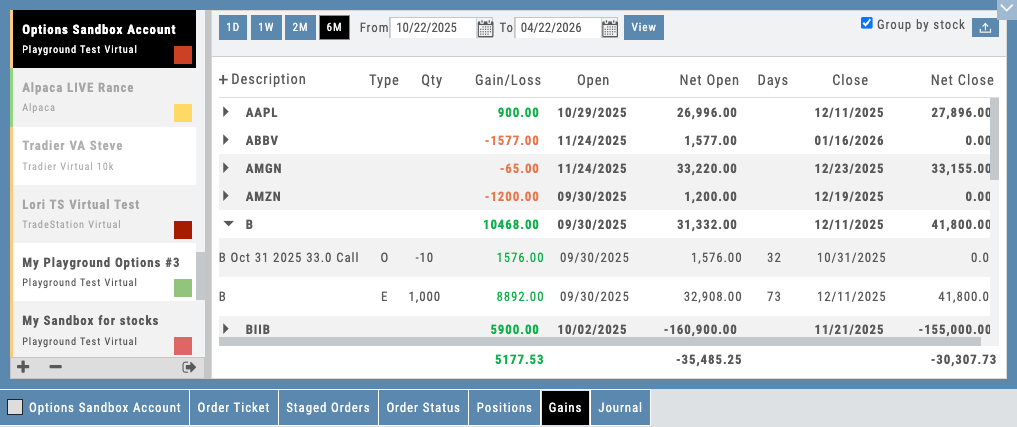
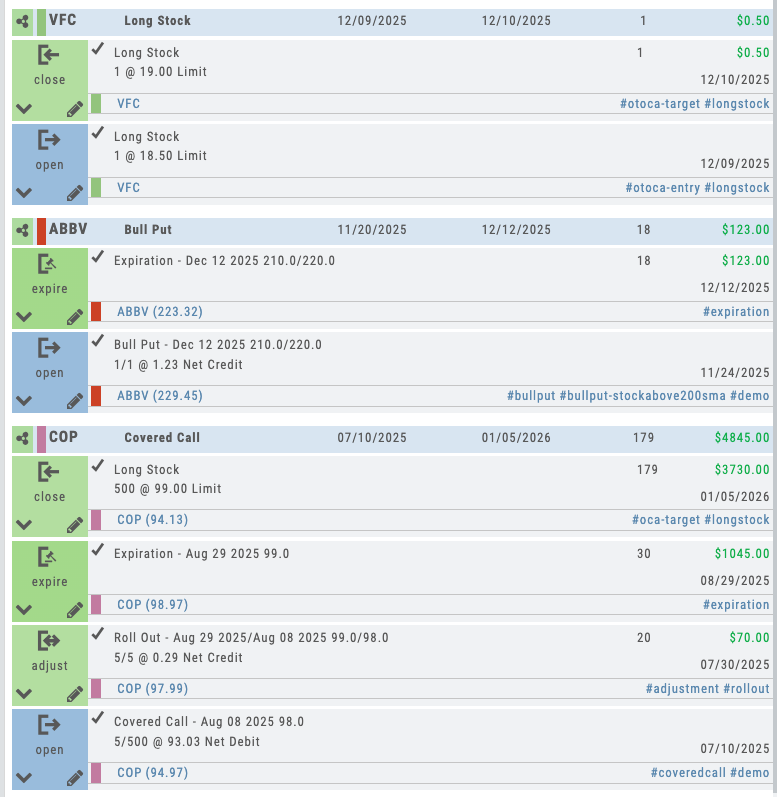
Life-of-Trade Tracking
Follow every trade from open through every adjustment to final close. Complete history. Complete context.
A trade is never just one transaction. It’s opened, adjusted, rolled, closed. Most journaling tools capture the final close P&L and call it done. iVest+ captures the full story: entry date, first adjustment date, second adjustment, roll details, closure date, and P&L at every stage.
This timeline view shows traders (and their coaches) exactly how the trade evolved. They can see why an adjustment was made, when the decision to close came, what the cumulative P&L was at each decision point. It’s the difference between seeing a final score and watching the entire game.
For educators, this feature is the retention secret. Students stay engaged far beyond the course when they can review their actual decision-making journey. Every mistake becomes a learning moment. Every successful adjustment becomes evidence of growth.
- Complete trade timeline from entry to close
- Every adjustment recorded with date, price, and reason
- Rolls and defensive closes tracked separately
- P&L snapshot at every decision point
- Enables pattern analysis: which adjustments worked? Which didn’t?
03 — Auto-Tags
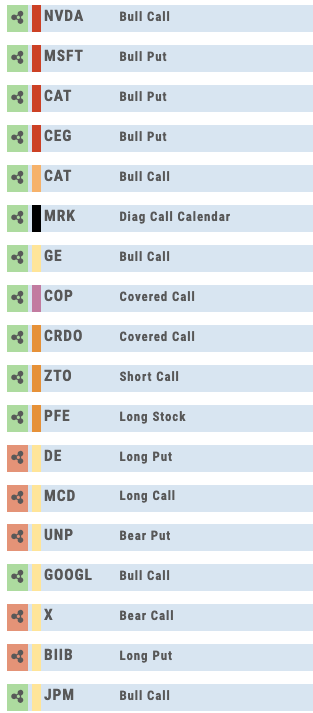
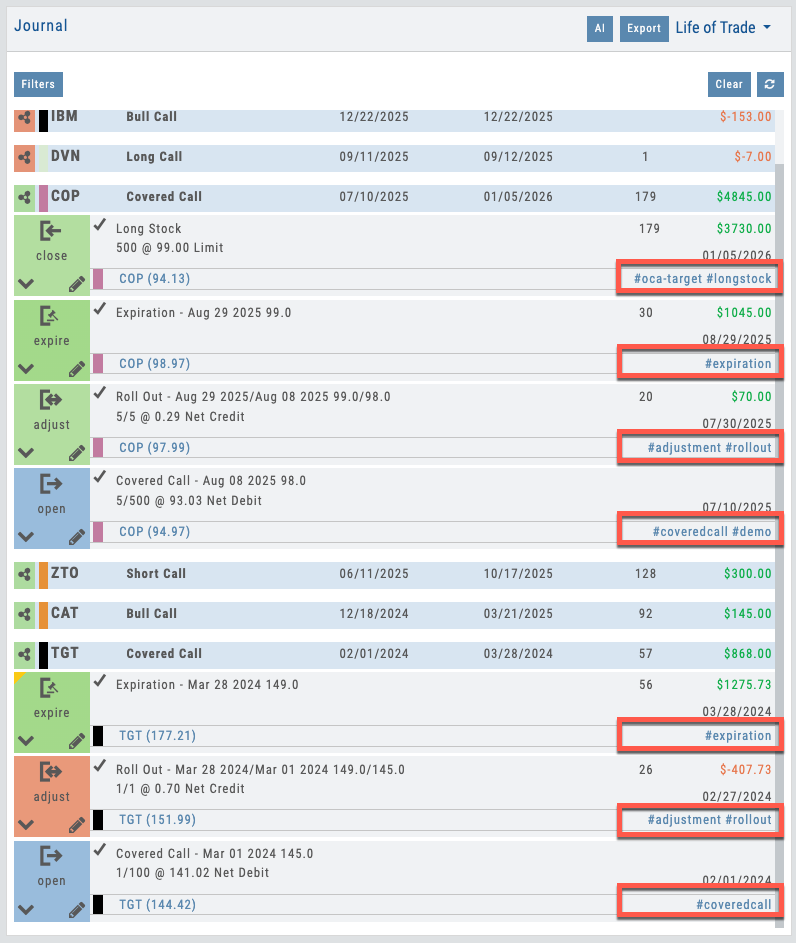
Every Trade Tagged, Automatically
Found it in a scan? Tagged. Set a bracket? Tagged. Rolled a covered call? Tagged. Hit your target or stopped out? Tagged.
The journal doesn’t just record trades — it categorizes them so you can see exactly what’s working and what isn’t. Beyond the 80+ strategy identifications, the system tags every contextual detail: which scan or condition triggered the trade, whether a full bracket was set, if the user rode through expiration, rolled out a position, or made an adjustment. It even analyzes whether the target or the stop was hit more often.
Add your own custom tags on top. Tag by thesis, market regime, setup type — anything. Then slice your performance reports by any combination. The auto-tagging turns raw trade data into structured, measurable intelligence.
For educators and coaches, this is where the journal becomes a teaching tool. Instead of asking “what happened?” you can see exactly how a student found the trade, how they managed it, and whether their process is producing results. The tags make every coaching conversation specific, data-driven, and actionable.
- Scan and condition source tagging — know how every trade was found
- Bracket, adjustment, and roll tracking — every management action tagged
- Target vs. stop analysis — see which exit hit more often
- Expiration behavior tracking — held, closed early, or rolled
- Custom tags — slice performance by any category you define
Trades automatically tagged by source, strategy, bracket behavior, and outcome
04 — Stock Research Context
Your Trade History Follows the Ticker
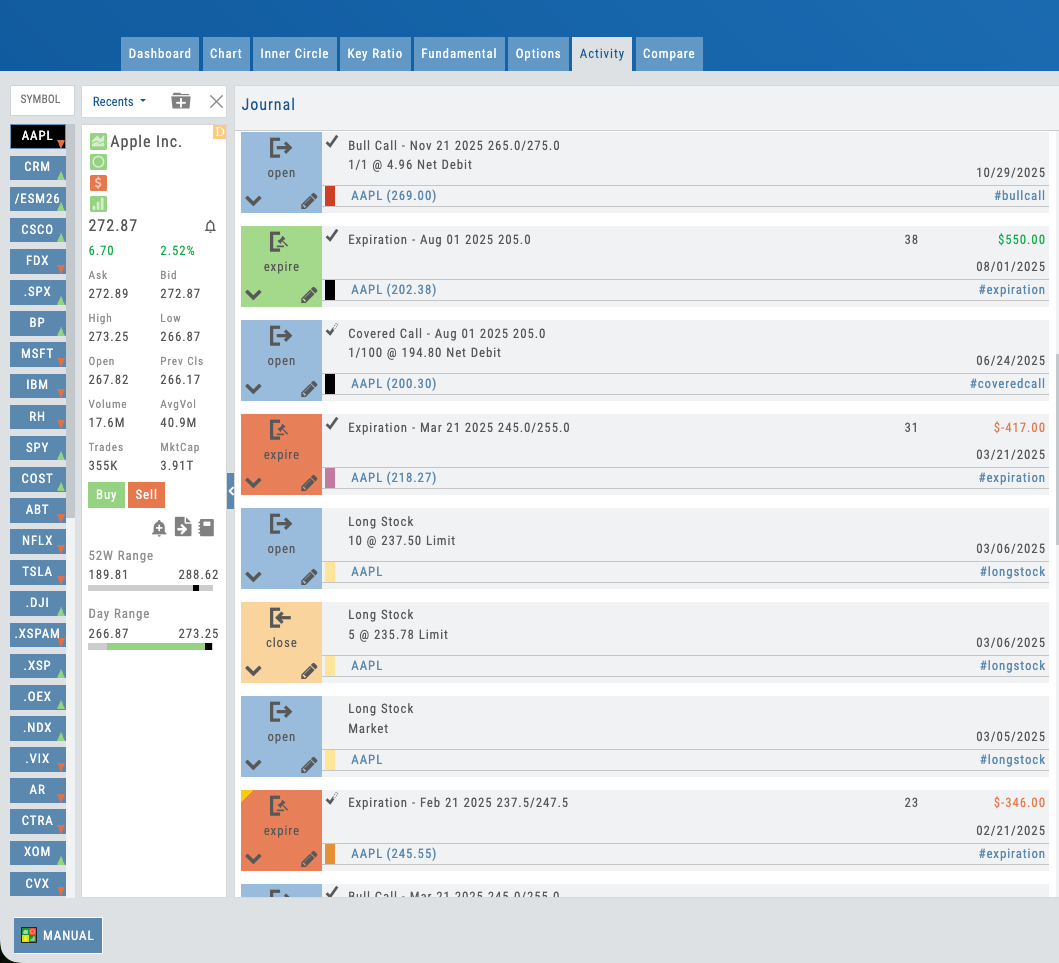
Pull up any stock in Research and your entire journal for that ticker is one tab away — trades, tags, and performance already filtered for you.
Every time your traders open a chart in Stock Research, the Activity tab is right there showing every trade they’ve ever placed on that symbol — executions, adjustments, closes, roll history, and the auto-generated strategy tags. No switching tools. No cross-referencing spreadsheets. No trying to remember what worked last time on AAPL earnings.
The tag-reporting panel on the right automatically filters to the ticker in view, so a quick glance tells the full story: P&L on this symbol, win rate, which strategies performed here, average hold time, and how current positions are behaving. It’s the journal, scoped to the exact decision the trader is about to make.
For B2B partners, this is where the coaching loop closes. Advisors reviewing a client’s position see the full history on that name in one screen. Educators demoing a trade idea pull up their own prior results as proof. Compliance teams audit by ticker without stitching reports together. The journal stops being a separate tool — it becomes context that follows every research session.
- Activity tab — every prior trade on the ticker, in chronological order
- Strategy tags and life-of-trade data shown inline for each entry
- Tag-reporting panel auto-filters to the symbol in view
- P&L, win rate, and hold-time stats scoped to this ticker only
- Open positions with real-time Greeks and adjustment history
- One-click jump back to full trade detail in the journal
- Cross-account view — see activity across every linked account at once
Stock Research Activity tab — every trade and tag for the ticker in view
Tag-reporting panel auto-filtered to this symbol — P&L, win rate, and strategy breakdown at a glance
05 — Performance Intelligence
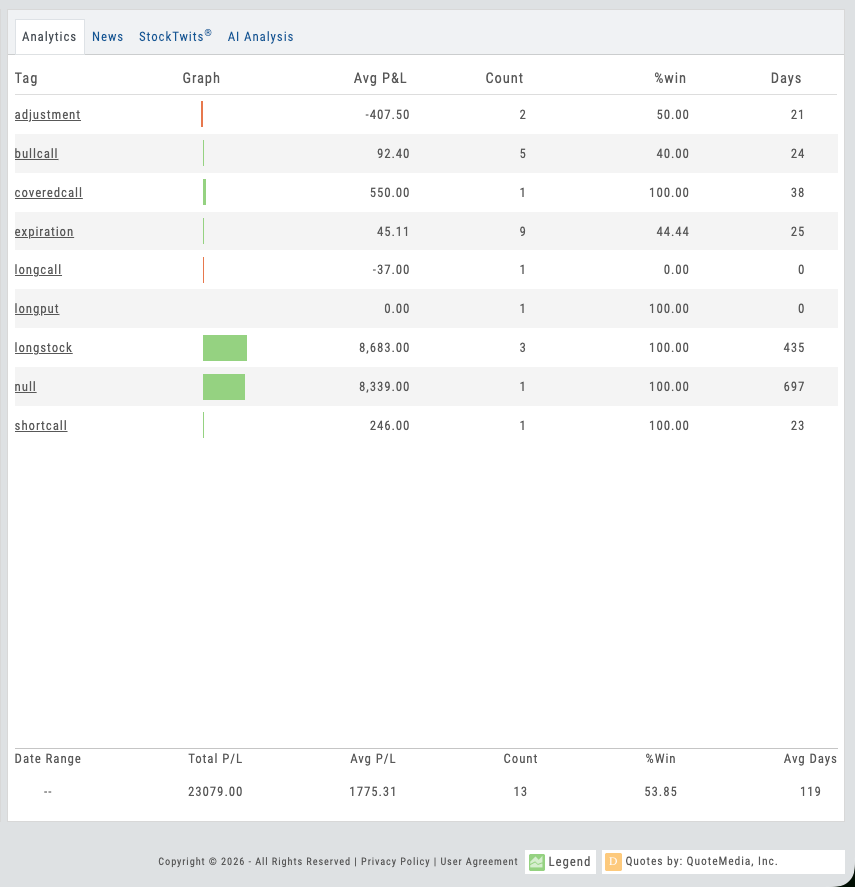
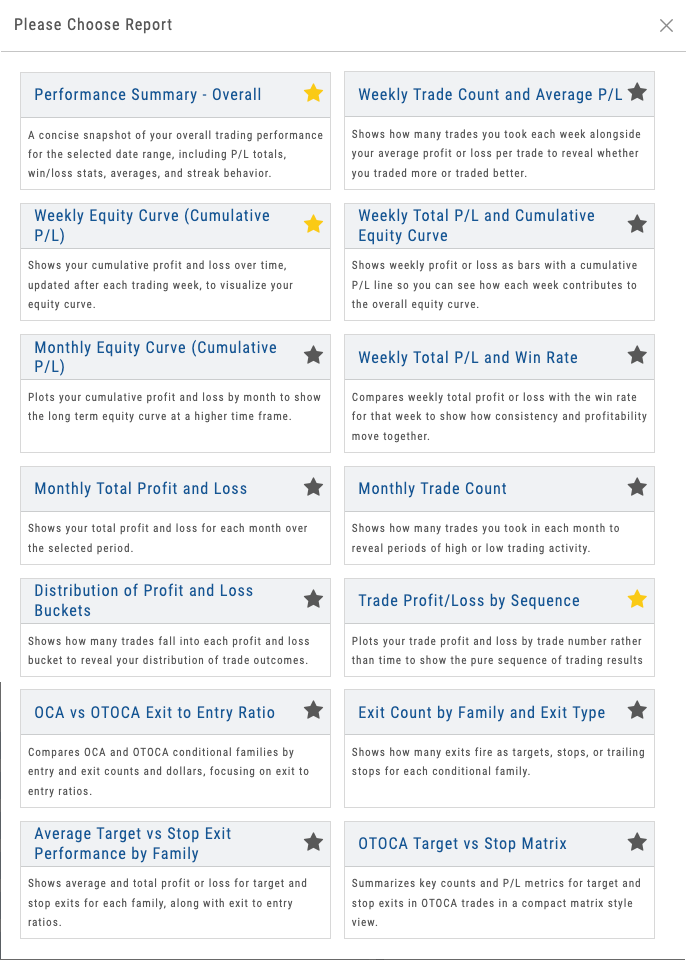
25+ Performance Reports
Tag analytics. Visual breakdowns. Pattern discovery. All based on actual trading data.
Strategy ID tags are the foundation for real analytics. The platform generates 25+ performance reports, all built on the automatic strategy classification: P&L by strategy type, win rate by tag, average holding period per strategy, profitability by underlying, performance by time-of-day, adjustment success rates, and custom breakdowns by hashtags.
Your students (and your coaches) don’t have to wonder what they’re good at and what needs work. The data tells the story. Iron condors beating spreads? The reports show it. Earnings trades underperforming? Visible in seconds. Adjustments actually improving position P&L? Quantified.
For B2B partners, these reports transform the journal from a record-keeping tool into a performance management system. Coaches see student strengths and blind spots without digging through trade history. Educators track cohort performance by strategy type across hundreds of students.
- P&L by strategy type — see which strategies are profitable
- Win rate by tag — percentage of winning trades per strategy
- Average holding period per strategy
- Profitability by underlying symbol
- Performance by time-of-day and market conditions
- Adjustment success rates — which defensive moves worked?
- Custom hashtag analytics — track performance on topics you define
Dashboard showing P&L by strategy, win rate, and performance breakdowns
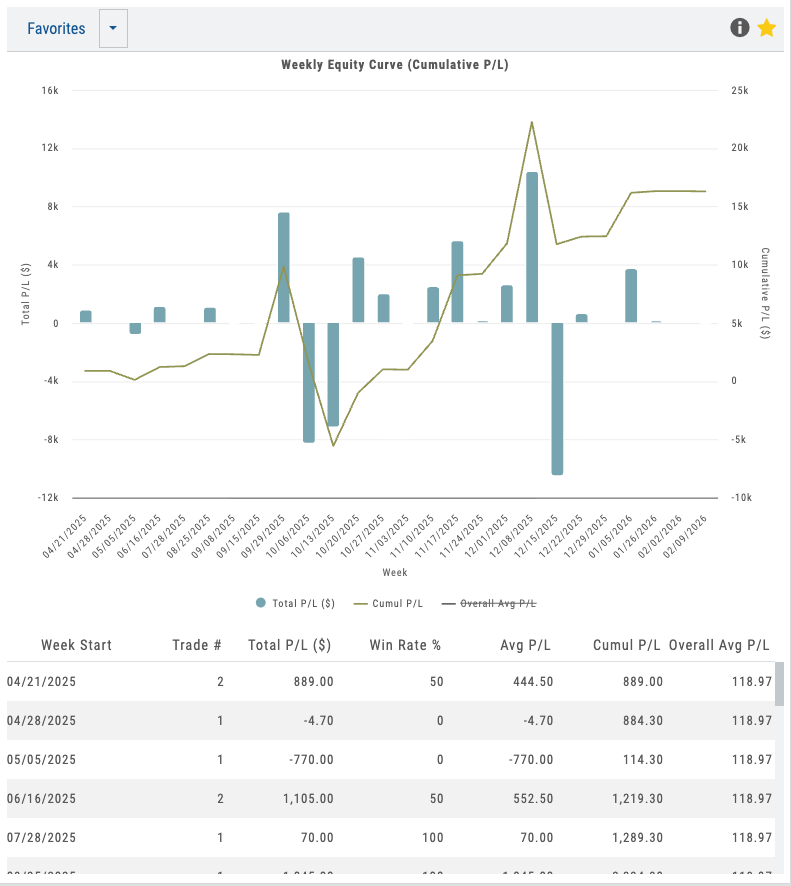
Weekly equity curve with cumulative P&L and win-rate by week
Want Your Students' Trades Analyzed Automatically?
Automatic journaling and strategy identification under your brand. Your students keep their trades logged, your coaches get actionable insights, and you eliminate manual review overhead.
AI analysis showing strengths, blind spots, and pattern insights from 100+ trades
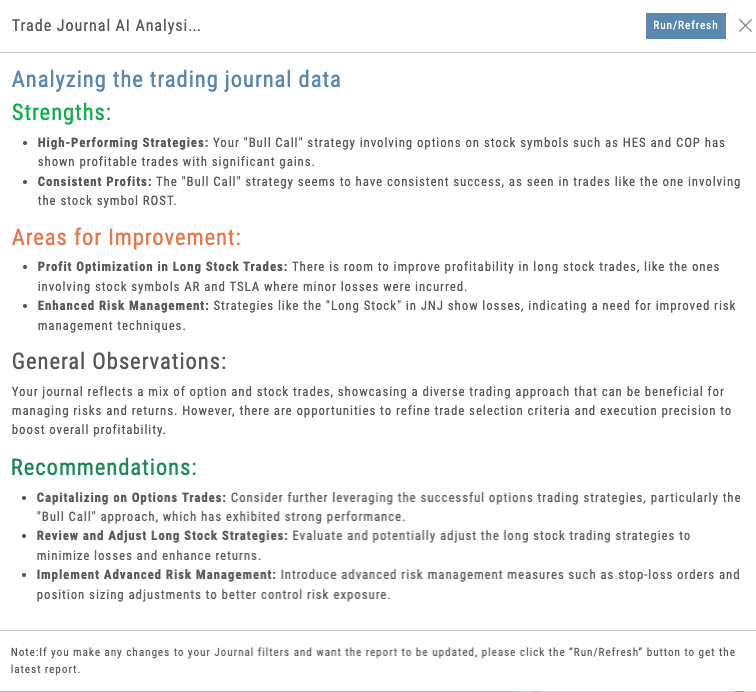
06 — AI-Powered Coaching
AI Journal Analysis
AI reads your performance data and surfaces patterns. Specific to your trades, not generic advice.
The 80+ automatic strategy tags unlock another layer: AI analysis. The system analyzes hundreds of completed trades across each strategy type and identifies patterns unique to each trader.
It doesn’t generate generic trading tips. It reads actual performance data and surfaces specific insights: “Iron condors in XYZ are 72% profitable vs. 58% overall — this is your strength.” “Your adjustments on downside breaks work 65% of the time — scaling these earlier would protect gains.” “Earnings trades show -2% average ROI — consider avoiding earnings week.”
For educators, this is the 8-AI-powered features promise realized. Students get personalized coaching from data analysis. Partners get the ability to flag high-risk patterns across their entire user base and address them proactively.
- Pattern identification across 100+ trades
- Strengths and blind spots surfaced automatically
- Strategy-specific insights based on your actual P&L data
- Adjustment effectiveness analysis
- Time-based and market-condition performance analysis
- Not generic AI chat — specific to your performance data
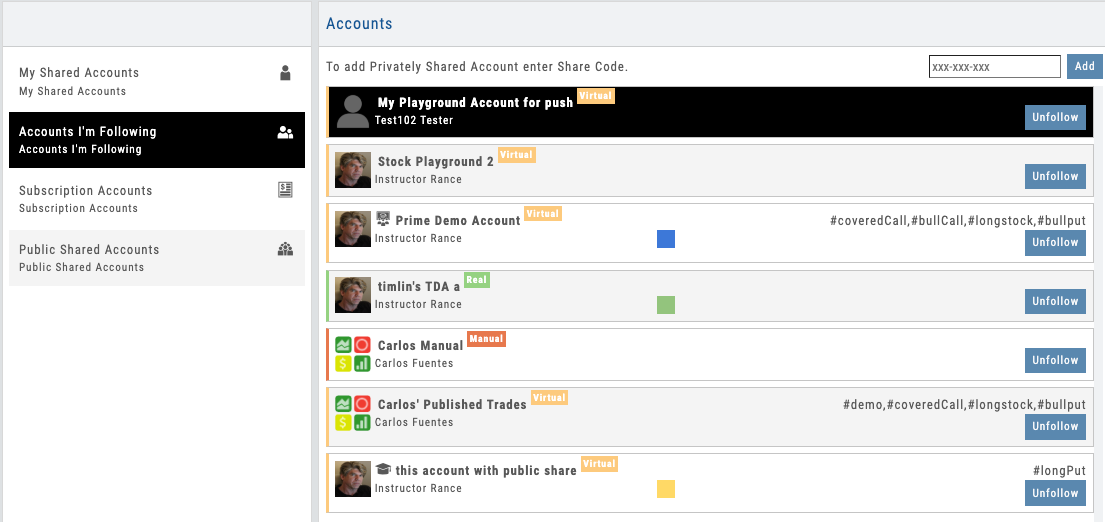
07 — B2B Proof Point
Partner Coaching Access
With user permission, partners can view full student journals. See notes, tags, strategy IDs, P&L, adjustments, and life-of-trade.
The journal becomes a collaborative coaching platform. Partners can view any user’s full trade history (with permission), see what strategies they’re trading, review adjustment decisions, track P&L progression, and provide targeted feedback without managing multiple data sources.
This is the feature that transforms iVest+ from a student tool into an educator’s platform. You don’t teach in a vacuum. You coach with full visibility into what your students are actually trading, how they’re managing risk, which strategies they’re executing well, and where they need guidance.
Unlike generic platforms where trade data is locked in a personal account, iVest+ gives educators and coaches the collaborative visibility they need. Your students’ trades are their own, but with permission, coaching becomes informed, specific, and dramatically more effective.
This coaching access capability is the major B2B proof point — this is why educators choose iVest+ and why they build their programs around it.
- View student journals with explicit user permission
- See strategy IDs, tags, life-of-trade progression
- Review P&L at each decision point
- Identify coaching opportunities without manual review
- Track cohort performance across hundreds of students
- Provide targeted feedback based on actual trade data
- Transforms journal into collaborative coaching platform
Coach view showing student trade history, strategy tags, and P&L progression
Cohort rollup — spot outliers, flag coaching opportunities across the whole class
Automated Trade Intelligence Under Your Brand
- ✓ Automatic leg-level trade matching
- ✓ Automatic tagging and tag analysis
- ✓ 80+ strategy identification
- ✓ 25+ performance reports
- ✓ Life-of-trade tracking
- ✓ AI-powered analysis
- ✓ Partner coaching access
All deployed under your branded platform. Your students keep focused on trading. Your coaches get the visibility and insights they need to teach effectively. You get the retention and B2B proof point that builds sustainable business.
Trades imported automatically from Schwab, Tradier, and more. See all supported brokers →
Charting
Charting Module
Where Analysis Meets Action
100+ indicators. Trade lifecycle visualization. Bracket orders with risk-based sizing. Backtesting overlays. AI pattern recognition. All on one chart — and all under your brand. Explore the hotspots to see what’s inside.
Charting Workspace
Interactive Guide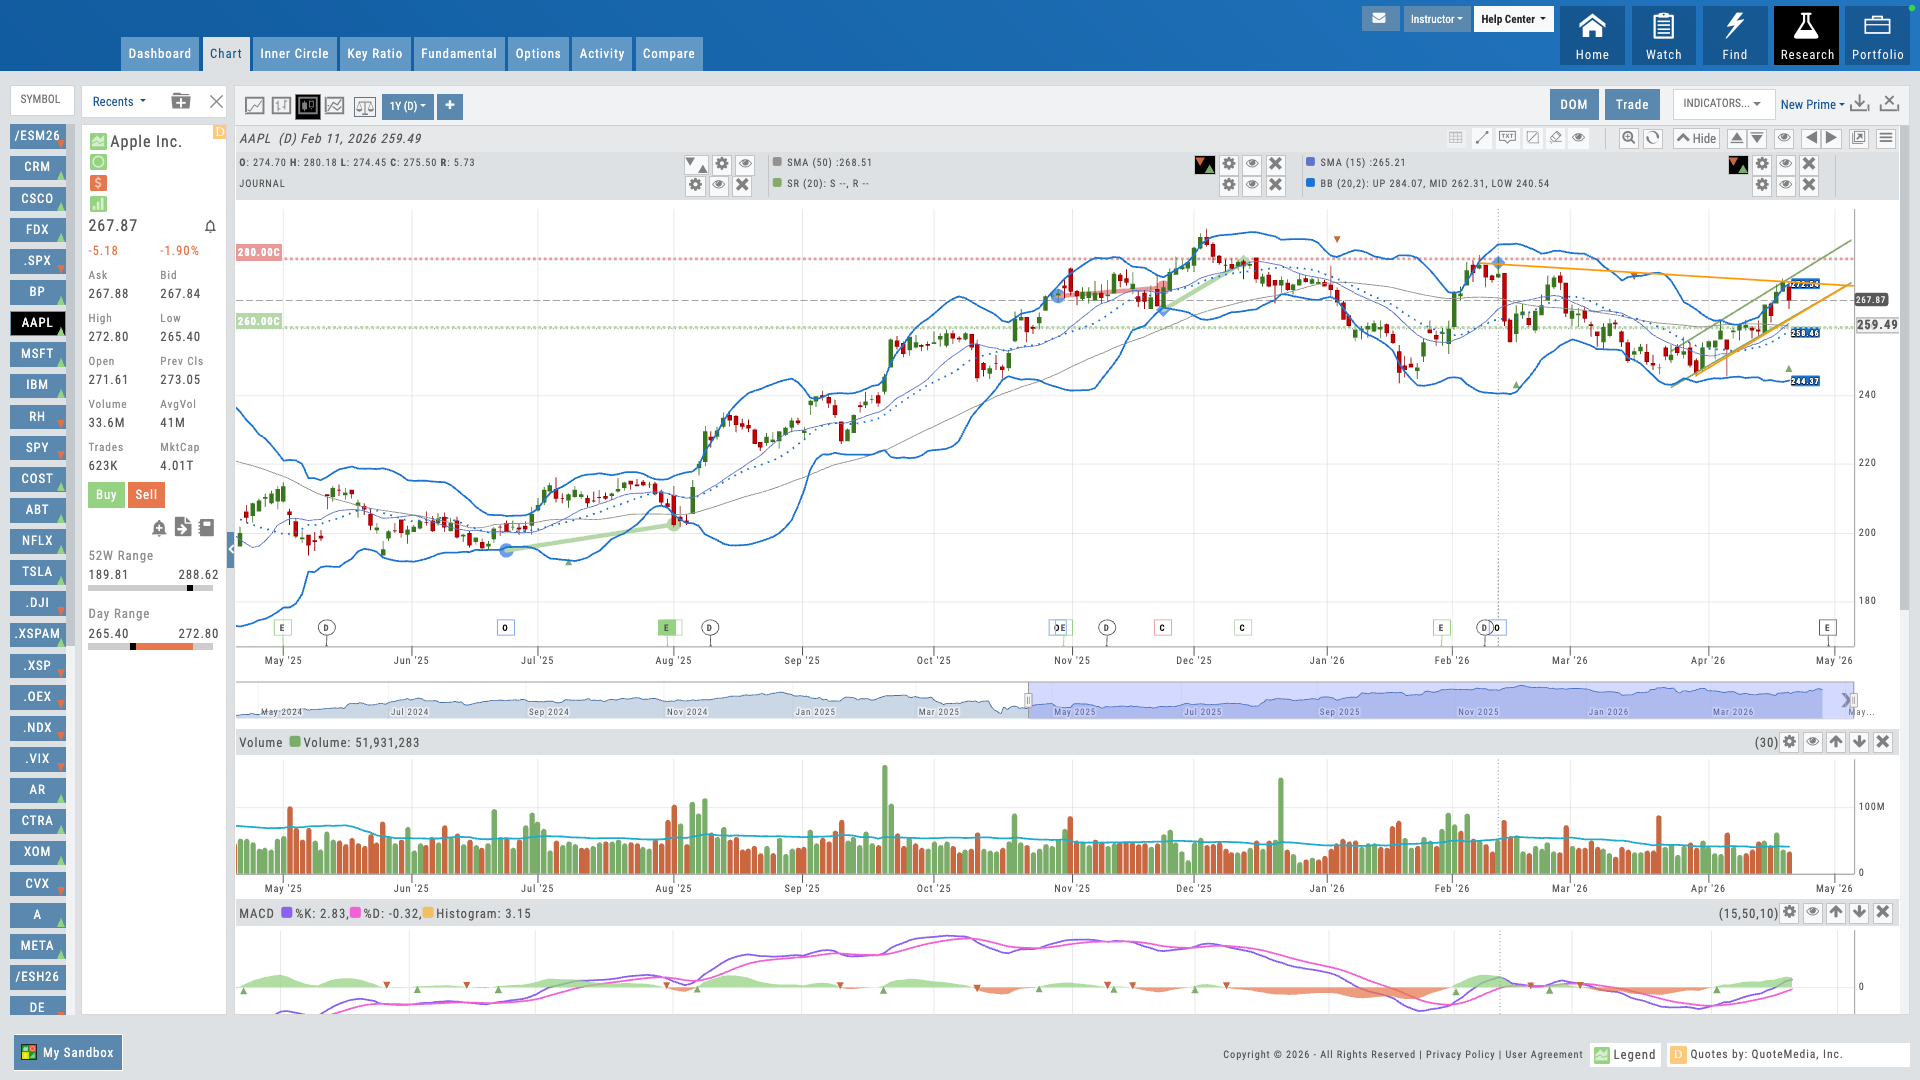
Hover over the pulsing dots to explore features
01 — Core Differentiator
Trade from Chart
Bracket orders, risk-based sizing, and direct trade management — without leaving the chart.
Most platforms separate charting from order entry. iVest+ connects them. Your users can build bracket orders directly on the chart — set entries, stops, and targets visually, then let the platform calculate position size based on their risk parameters. No switching between windows. No mental math. The trade is right where the analysis happens.
For educators, this changes how you teach trade management. Students see the entry, the stop, the target, and the risk — all in one view. It makes abstract concepts concrete and dramatically reduces execution errors.
- Draw your entry, stop, and target right on the chart — by drag, by dollar, or by percentage
- Risk-based quantity sizing — set dollar risk, platform calculates shares
Trade From the Chart
Interactive Guide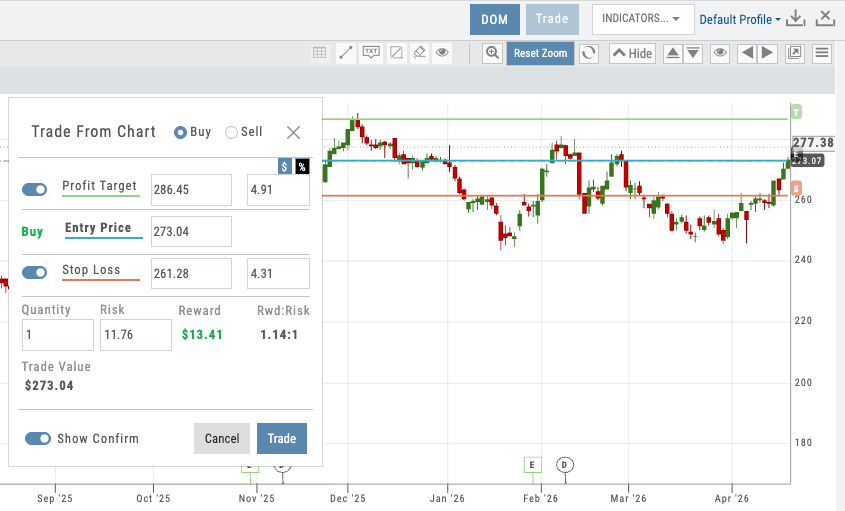
Bracket order on chart with entry/stop/target lines and risk sizing panel
Chart showing all 4 line styles — staged, working, open, closed
02 — Visual Workflow
Trade Lifecycle Visualization
Four distinct line styles show every stage of a trade — from idea to closed position.
Every trade tells a story on the chart. iVest+ uses four different line styles to show where a trade is in its lifecycle: staged trades appear as dotted lines, working orders as dashed lines, open positions as solid lines, and closed trades as historical markers. At a glance, your users know exactly what’s active, what’s pending, and what’s done.
This isn’t just visual polish — it’s a teaching tool. When students can see a trade progress through its stages on the chart, they internalize the workflow: plan, execute, manage, review. No other charting platform visualizes the full trade lifecycle this way.
- Staged — dotted lines for planned but unsubmitted trades
- Working — dashed lines for orders sent to the broker
- Open — solid lines for active positions with P&L
- Closed — historical markers showing completed trades
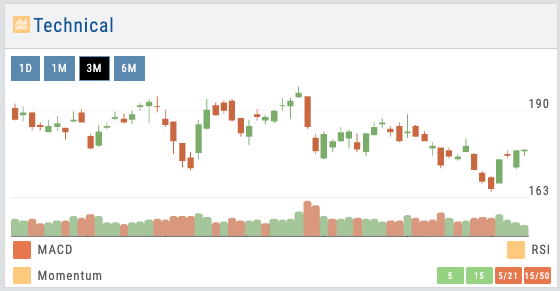
03 — Analytical Depth
100+ Indicators That Go Far Beyond Price and Volume
Every standard technical indicator, plus beyond-OHLCV data most charting platforms can’t touch — insider scores, institutional ownership, IV/HV, options volume by call/put, and more.
Every standard technical indicator is here — moving averages, RSI, MACD, Bollinger Bands, volume profiles, and dozens more. But iVest+ goes well beyond OHLCV. Chart the insider score to see Form 4 activity trends. Overlay institutional ownership percentage to track smart money accumulation. View historical and implied volatility side by side. Break down options volume and open interest by calls vs. puts. These are the indicators that give traders context most platforms simply don’t offer.
Each indicator is fully customizable — colors, parameters, line styles, and display position. More importantly for partners, you set the defaults. Which indicators appear on a new user’s chart, what parameters they use, what colors they render in — all pushed from the Admin Account. When an instructor says “when the green line crosses up through the red line, it’s a buy signal,” every student is looking at the same green line and the same red line. Teaching stops being a per-student screen-share and becomes a consistent visual language across your user base. The same control extends to system profiles — full indicator collections, pre-configured and owned by the partner.
And iVest+ will develop custom indicators tailored to your specific methodology — available exclusively in your branded platform.
- Technical indicators: MAs, RSI, MACD, Bollinger, Volume, and 90+ more
- Beyond-OHLCV: insider score, institutional ownership %, HV/IV, options volume and OI by call/put
- Full customization — colors, parameters, line styles, positioning
- Partner-set defaults — push your preferred indicators, parameters, and colors to every user from day one
- System profiles — curated indicator stacks controlled by the partner for consistent teaching
- Custom indicator development — built to your methodology, owned by you, exclusive to your platform
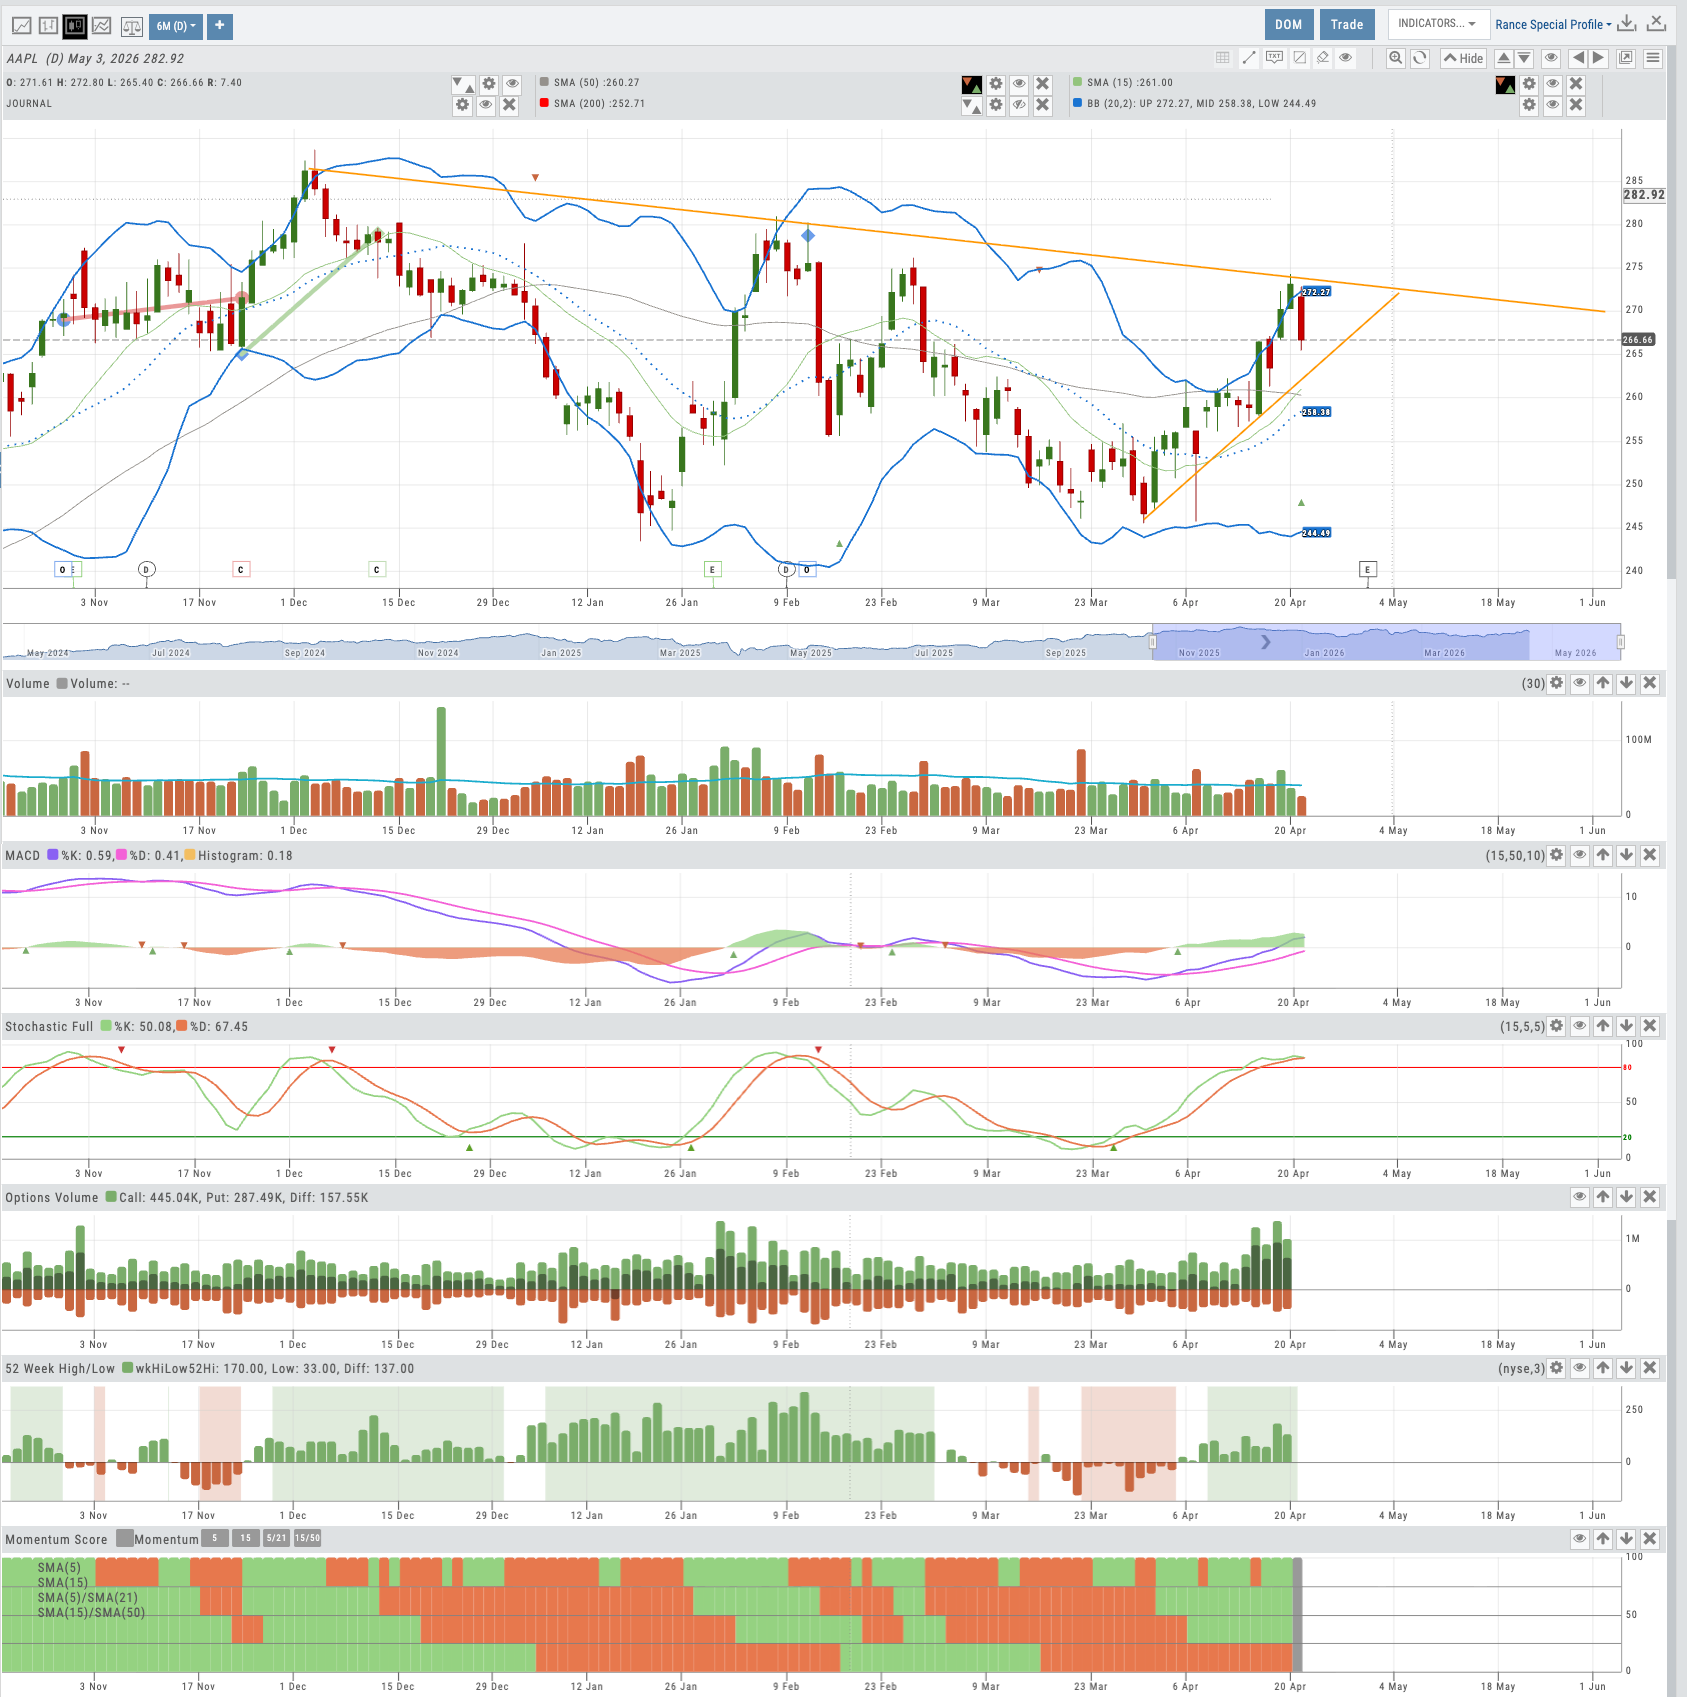
Chart with multiple indicators stacked, including insider score and IV/HV overlays
Partner-set defaults — same indicators, same parameters, same colors for every user from day one
Want to Offer Advanced Charting Under Your Brand?
Trade from Chart, lifecycle visualization, and 100+ indicators — deployed as part of your branded platform.
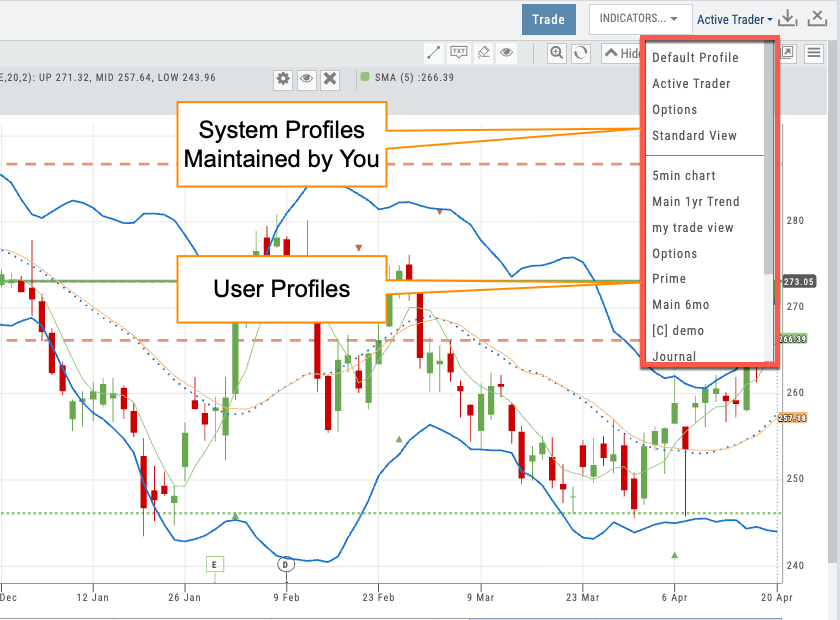
Profile selector showing partner-prefixed defaults and user profiles
04 — Partner Control
Chart Profiles & Admin Account
Save configurations. Push them to every user. Keep your brand experience consistent from day one.
Chart profiles let users save their preferred indicator setups, timeframes, and display preferences. For individual traders, that means faster workflow. For partners, it’s a control lever: use the Admin Account to push default chart profiles to every user on your platform.
When a new student logs in, they see the chart configuration you’ve chosen — your preferred indicators, your color scheme, your layout. They start with a guided experience instead of a blank canvas. Profiles are prefixed with your partner tag, so your defaults are always distinguishable from user-created ones.
- Save and name unlimited chart profiles
- Admin Account pushes default profiles to all partner users
- Prefix-based organization ([C] tags) for partner vs. user profiles
- Users can customize from your defaults without overwriting them
05 — Full Context
Everything on One Chart
Current trades, past trades, backtesting results, and options legs — all visible in one view.
The iVest+ chart isn’t just a price display — it’s the central workspace. Open positions show with real-time P&L. Prior trades appear as historical reference so users can see what they did last time at this price level. Backtesting results overlay directly on the chart, showing exactly where a strategy would have entered and exited.
Even multi-leg options trades display on the chart, with each leg visible. This level of visual context turns the chart into a decision-making surface: users aren’t just looking at price — they’re looking at their entire trading history and current exposure in one place.
- Active positions with real-time P&L directly on the chart
- Prior trades as historical markers for pattern recognition
- Backtesting results overlaid with entry/exit points
- Options legs visible on the price chart
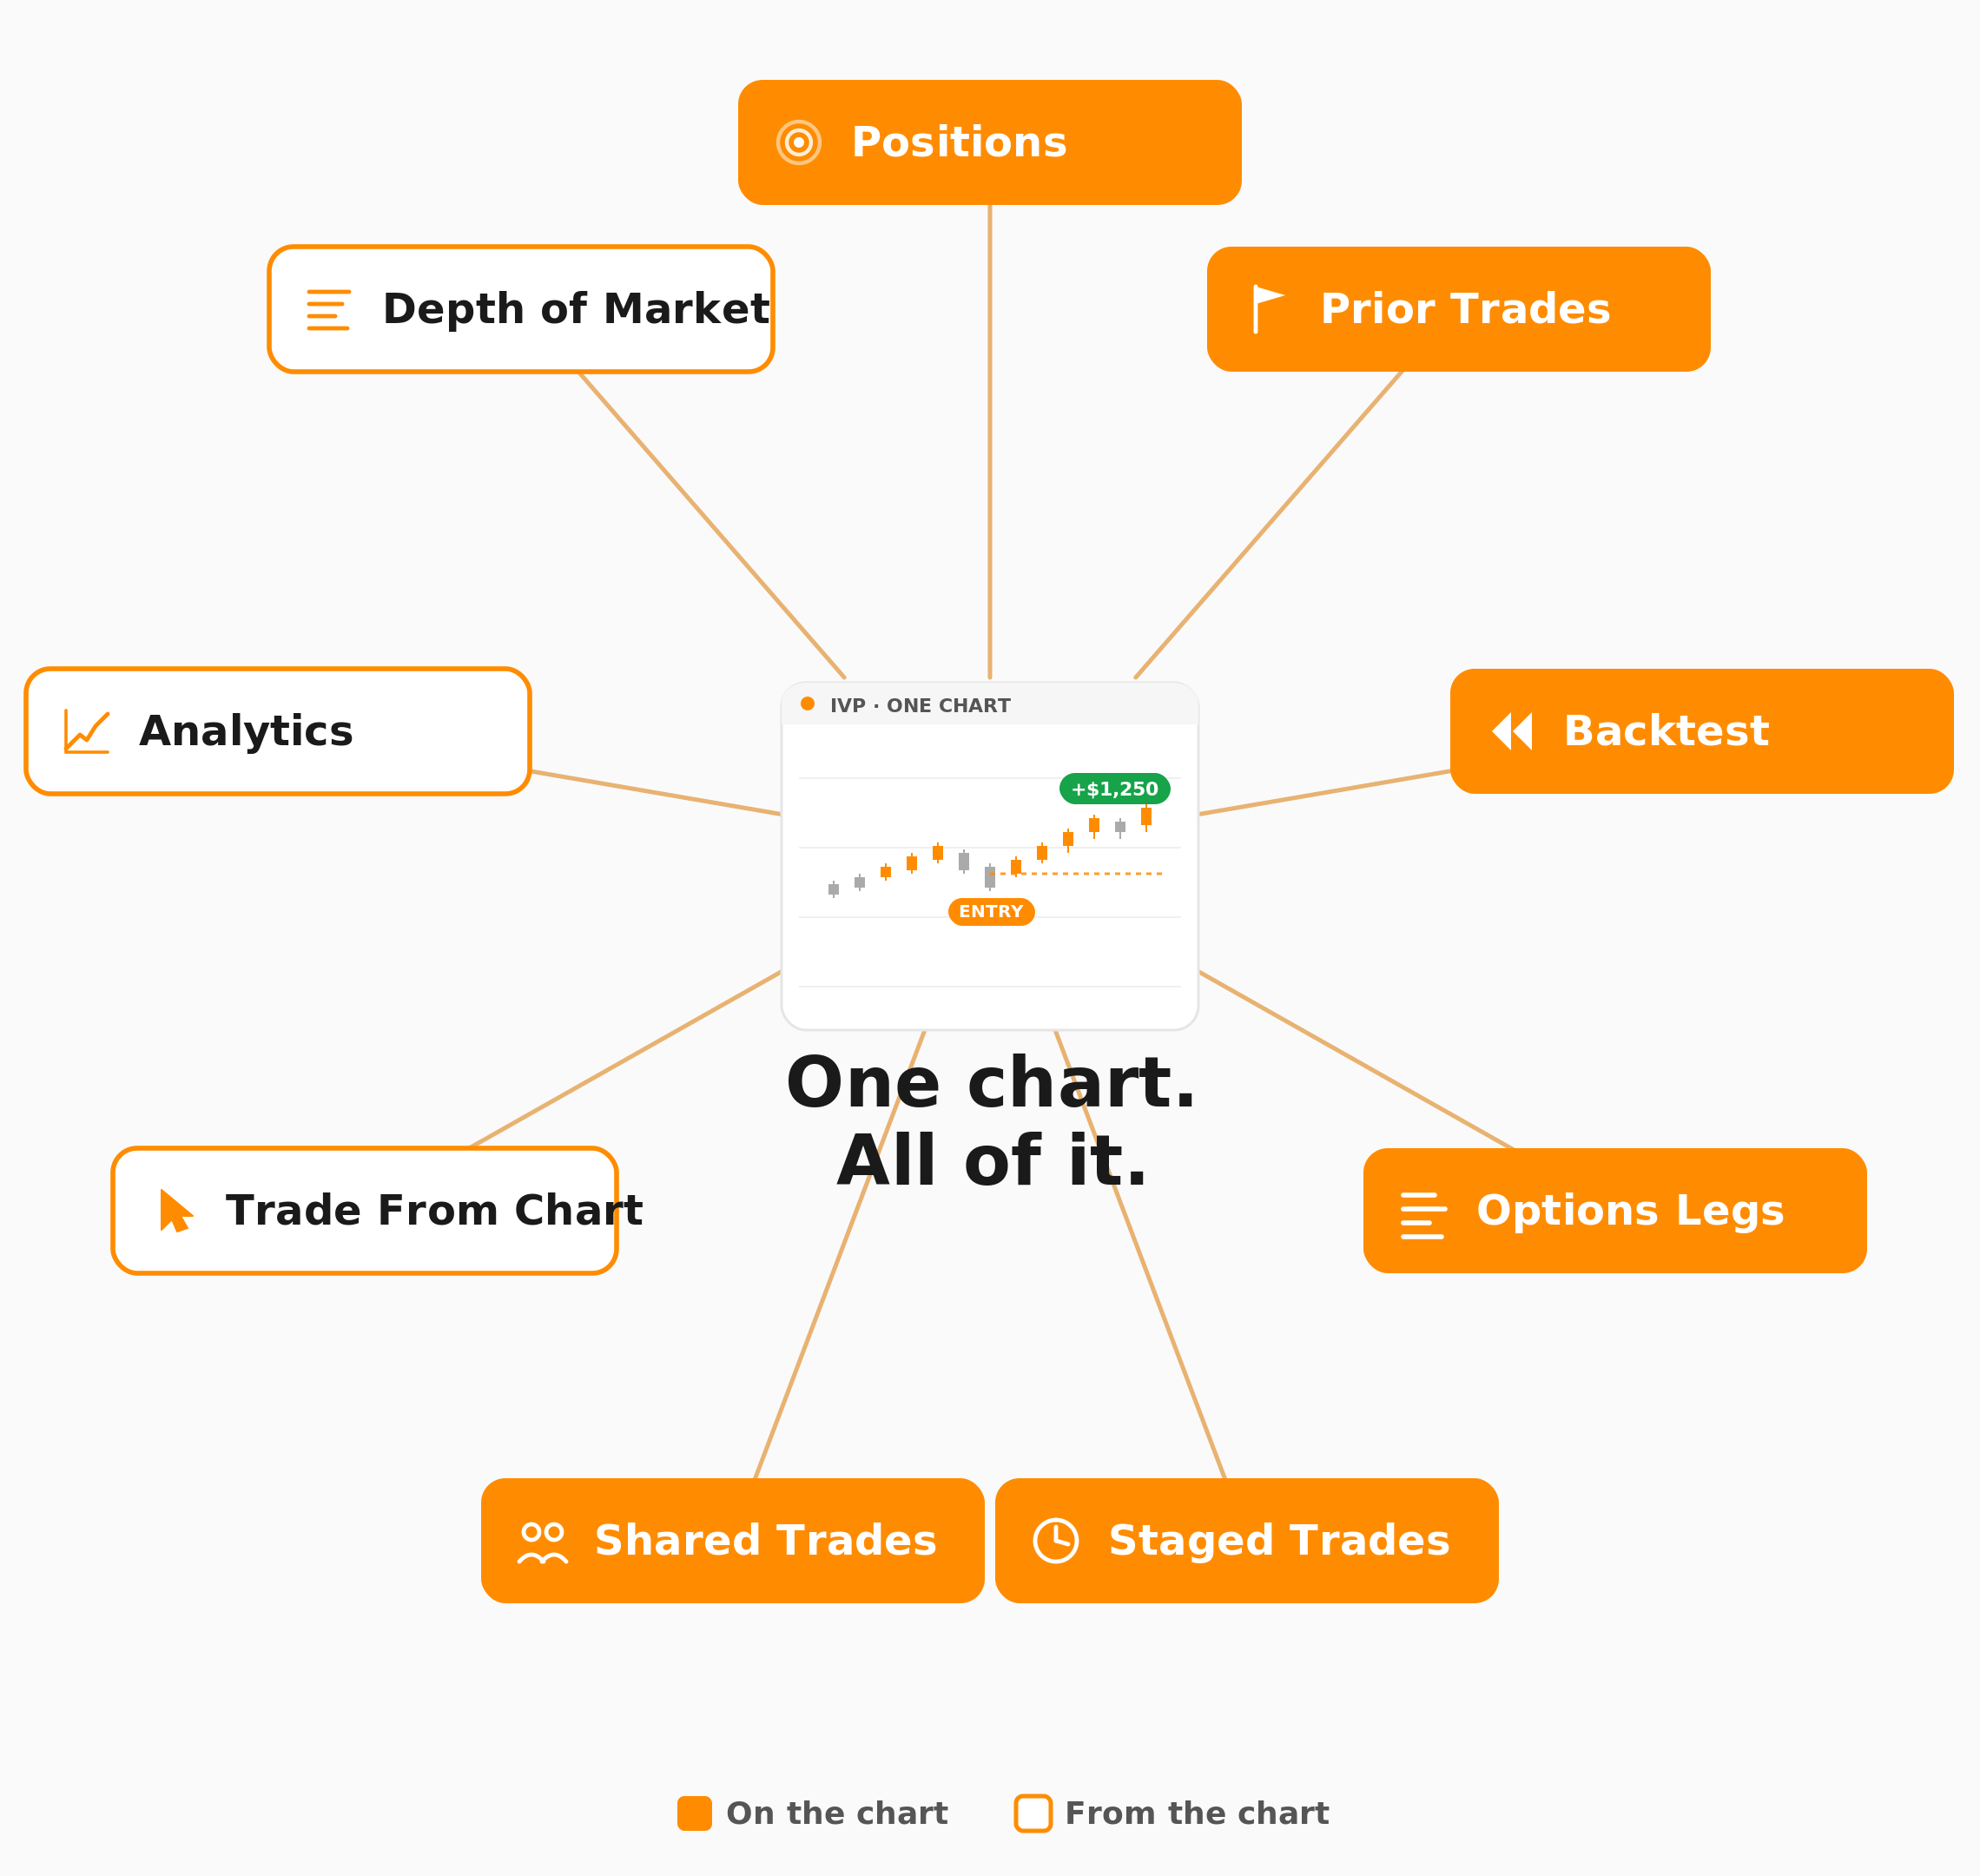
Chart showing active trade, prior trades, and backtest overlay together
Advanced Charting, Under Your Name
Trade from Chart, lifecycle visualization, 100+ indicators, AI technical analysis, and Admin Account control — all deployed as part of your branded trading platform. Your users get institutional-grade charting. You get a retention lever that keeps them coming back.
Connects to leading brokerages including Schwab, Tradier, and more. See all supported brokers →
Alerts
Alerts Module
The Feature That Brings Users Back Every Day
Price, volume, and indicator alerts with offset precision. Apply any alert to an entire watchlist. Add notes so you know exactly what to do when it fires. Set and manage from anywhere in the platform — desktop or mobile. The daily driver for retention.
Alerts Dashboard
Interactive Guide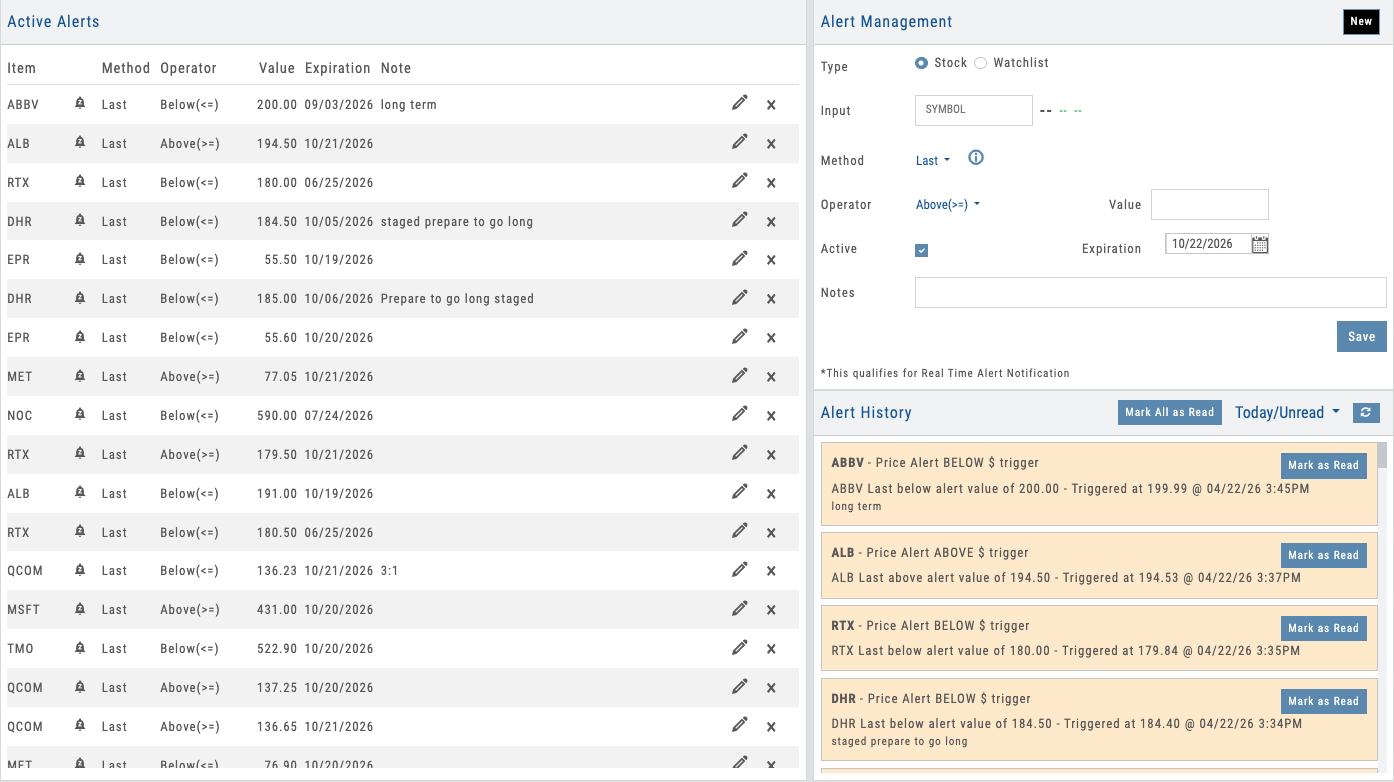
Alerts dashboard with multiple alert types, status indicators, and real-time tracking
01 — Alert Types & Precision Controls
Price, Volume & Indicator Alerts with Offset Precision
Set alerts on price levels, volume thresholds, or any of dozens of technical indicators — each with optional offset controls for precision timing. Apply any alert across an entire watchlist in one click.
Most platforms limit alerts to price: “notify me when SPY crosses 450.” iVest+ goes much further. Set alerts on price levels, volume spikes, moving average crossovers, Bollinger Band breaks, Keltner Channel touches, 6-month highs/lows, 52-week highs/lows, and more. Every alert type supports offset controls — set a 52-week high alert with a $0.50 offset to get notified just before the breakout, not after. And every alert can include a note, so when it fires, users see exactly what they planned to do — no scrambling to remember the thesis.
The real power is watchlist-level alerts. Apply any alert type to an entire watchlist: “notify me when anything on this watchlist hits a new 52-week high.” One setup monitors dozens of symbols. Each stock on the watchlist shows whether an alert is set and whether it’s fired, keeping users in context without navigating away.
- Price alerts — absolute levels, percent moves, gap detection
- Volume alerts — volume spikes and threshold breaks
- Indicator alerts — MA crossovers, Bollinger Bands, Keltner Channels, 6-month and 52-week highs/lows
- Offset controls — precision triggers like 52-week high minus $0.50
- Alert notes — attach your planned action so it’s right there when the alert fires
- Watchlist alerts — apply any alert across an entire watchlist; see set and fired status per stock
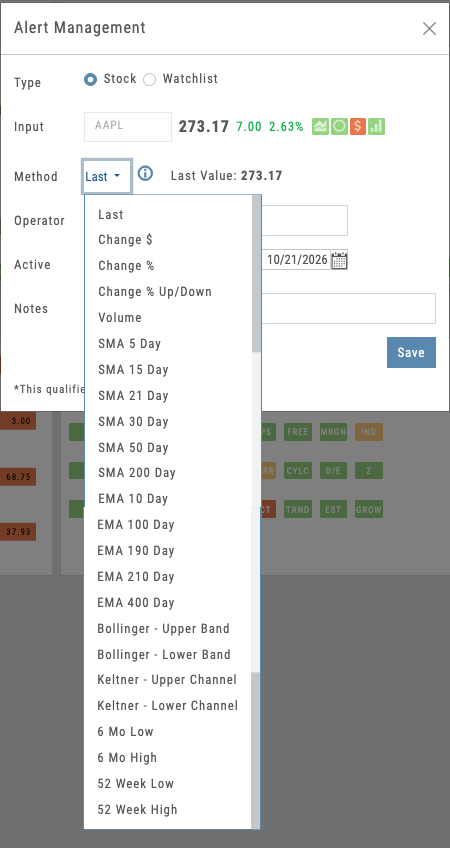
Alert builder with price, volume, and indicator options plus offset controls
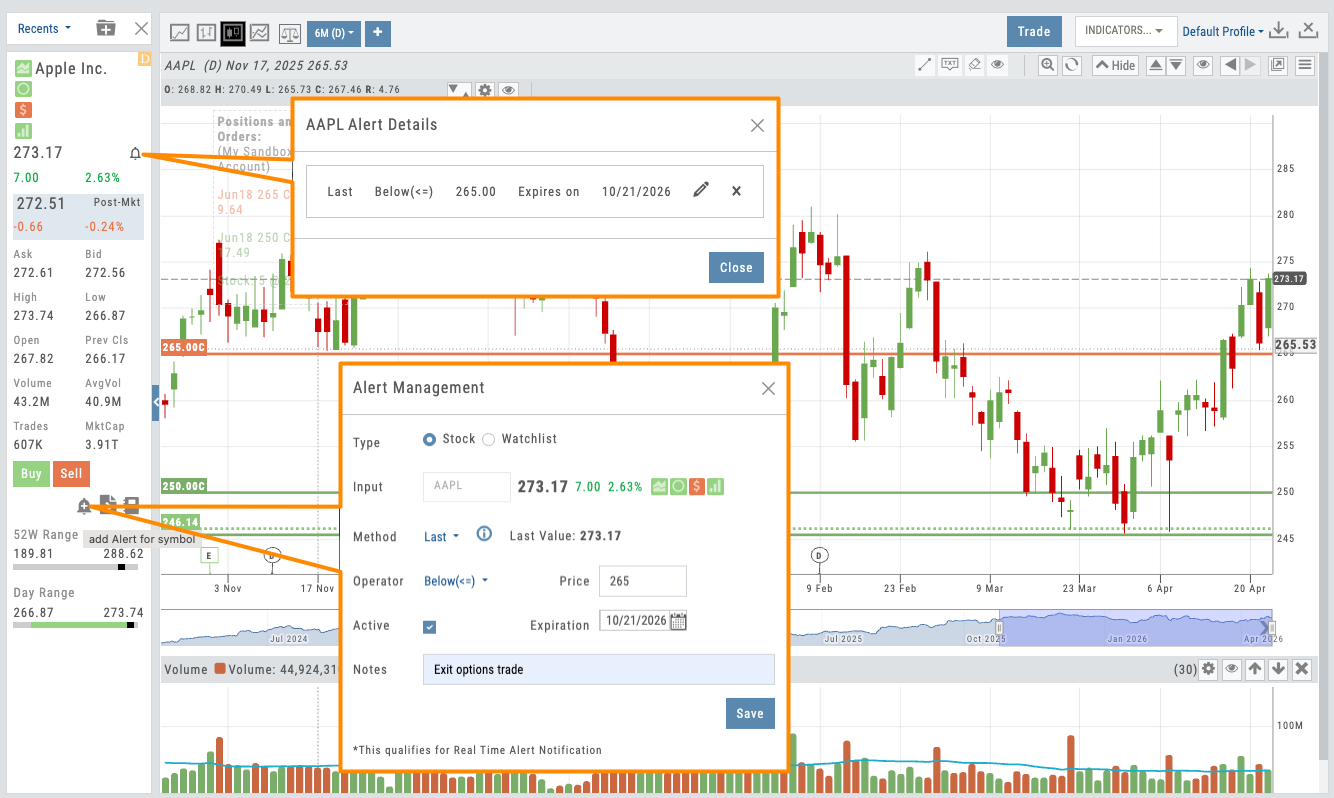
Alert creation from chart, watchlist, and research — manage from anywhere
02 — Quick Setup
Set and Manage Alerts from Anywhere
Set alerts from anywhere in the platform — charts, watchlists, research. Manage them in place. Works on desktop and mobile.
Alerts aren’t locked behind a dedicated page. Create and manage them from the chart, the watchlist, the research dashboard — wherever your users are working. On a chart, click a price level and an inline builder appears. On a watchlist, apply an alert across every symbol in one step. When an alert fires, the bell icon shows exactly what triggered — click to review your note, edit the alert, or reset it, all without navigating away.
The same experience works on mobile. Users create and manage alerts from the iOS or Android app just as easily as desktop. No friction, no context switching — which means more alerts created and more engagement loops triggered.
- Set alerts from charts, watchlists, research — anywhere in the platform
- Click price level → alert builder appears inline
- Click the bell icon on any fired alert to see what triggered
- Edit and manage alerts in place — no separate alerts page required
- Full alert creation and management on mobile (iOS and Android)
Want a Built-In Retention Engine for Your Platform?
Price, volume, and indicator alerts with offset precision, alert notes, and watchlist coverage — deployed as part of your branded platform.
03 — Alert History & Engagement Loop
Recently Triggered Alerts Drive Action
Alert history shows recently triggered alerts with one-click access to research, charts, and trading tools.
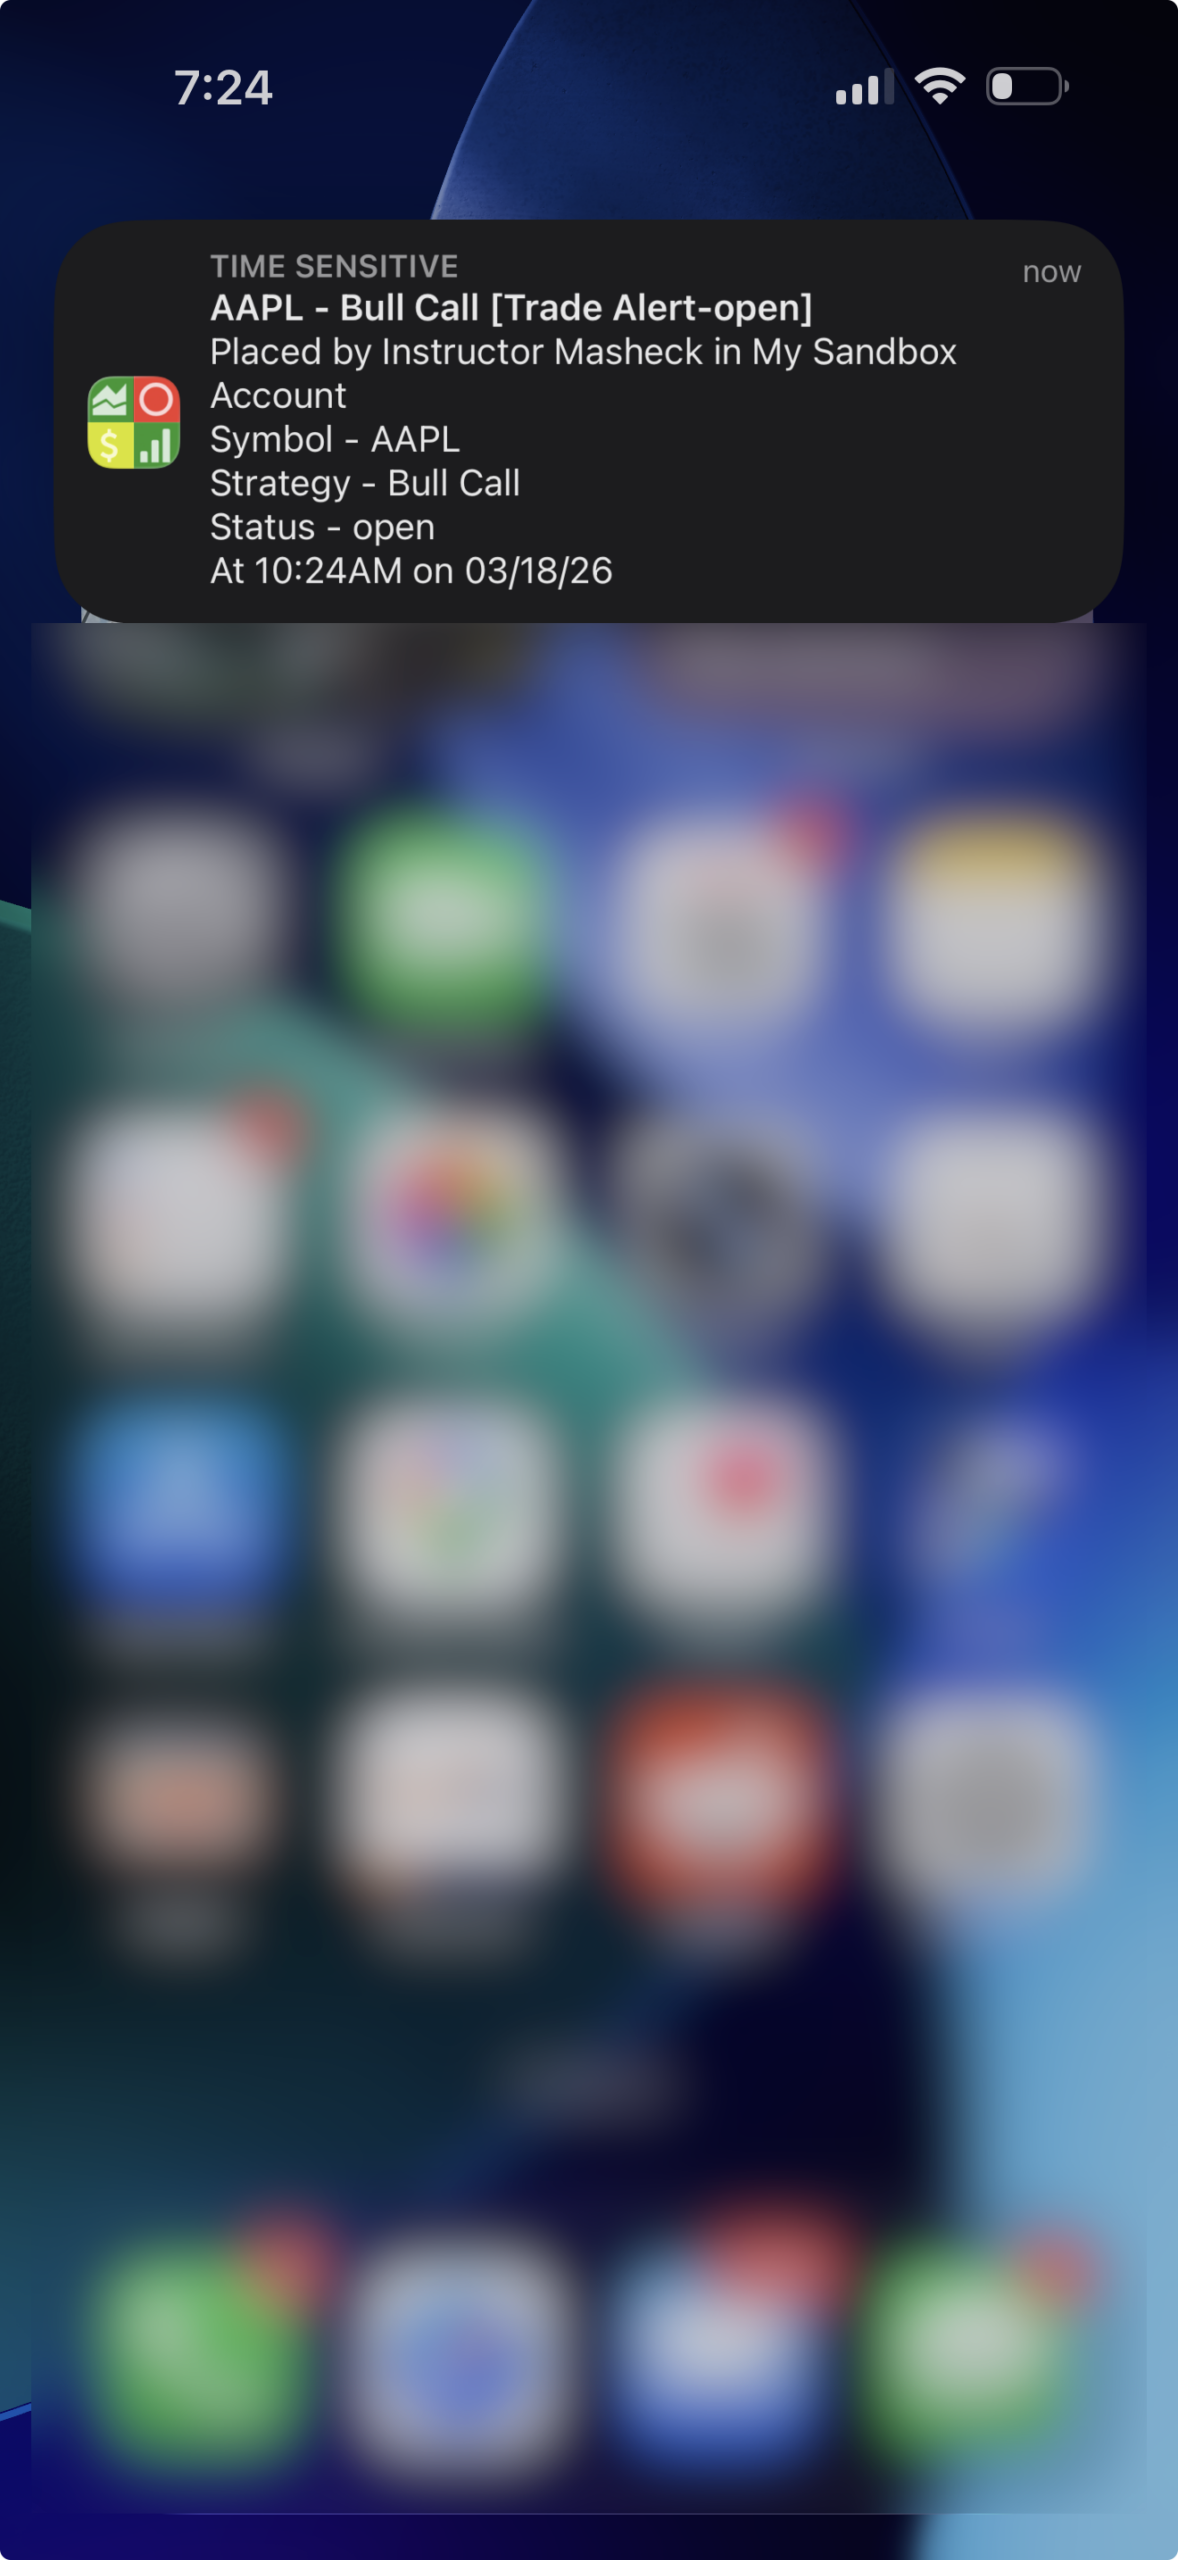
When an alert triggers, it’s not the end — it’s the beginning. Push notifications hit the user’s mobile device and appear in-platform simultaneously, so nothing gets missed. The alert shows the condition that fired, the note the user attached, and one-click access to the chart or research dashboard.
This is the engagement loop in action. Alert → push notification → open platform → review note → act. For partners, every triggered alert is a moment when users are primed to engage. The bell icon across the platform makes fired alerts instantly accessible — and watchlists visually distinguish which stocks have triggered, keeping the workflow tight.
- Push notifications to mobile device + in-platform alerts simultaneously
- Bell icon shows fired alerts — click to see exactly what triggered
- One-click navigation to chart, research, or trading tools
- Fired alerts visually distinguished on watchlists
- Alert history with timestamps, conditions, and engagement tracking
Alert history panel showing triggered alerts with navigation to chart and research
Daily Engagement Under Your Brand
Price, volume, and indicator alerts with offset controls, alert notes, and watchlist coverage. Set from anywhere. Manage in place. Push notifications on every trigger. All deployed as part of your branded platform — a proven retention engine that brings users back every day.
Connects to leading brokerages including Schwab, Tradier, and more. See all supported brokers →
Screener
Screener Module
The Deepest Screener on the Market
400+ data points across 25,000+ stocks. Tiered depth from beginner to institutional. AI-powered plain-language screening. Real-time options data. Find what you’re looking for without the overwhelm. Explore the hotspots to see what’s inside.
Screener Module
Interactive Guide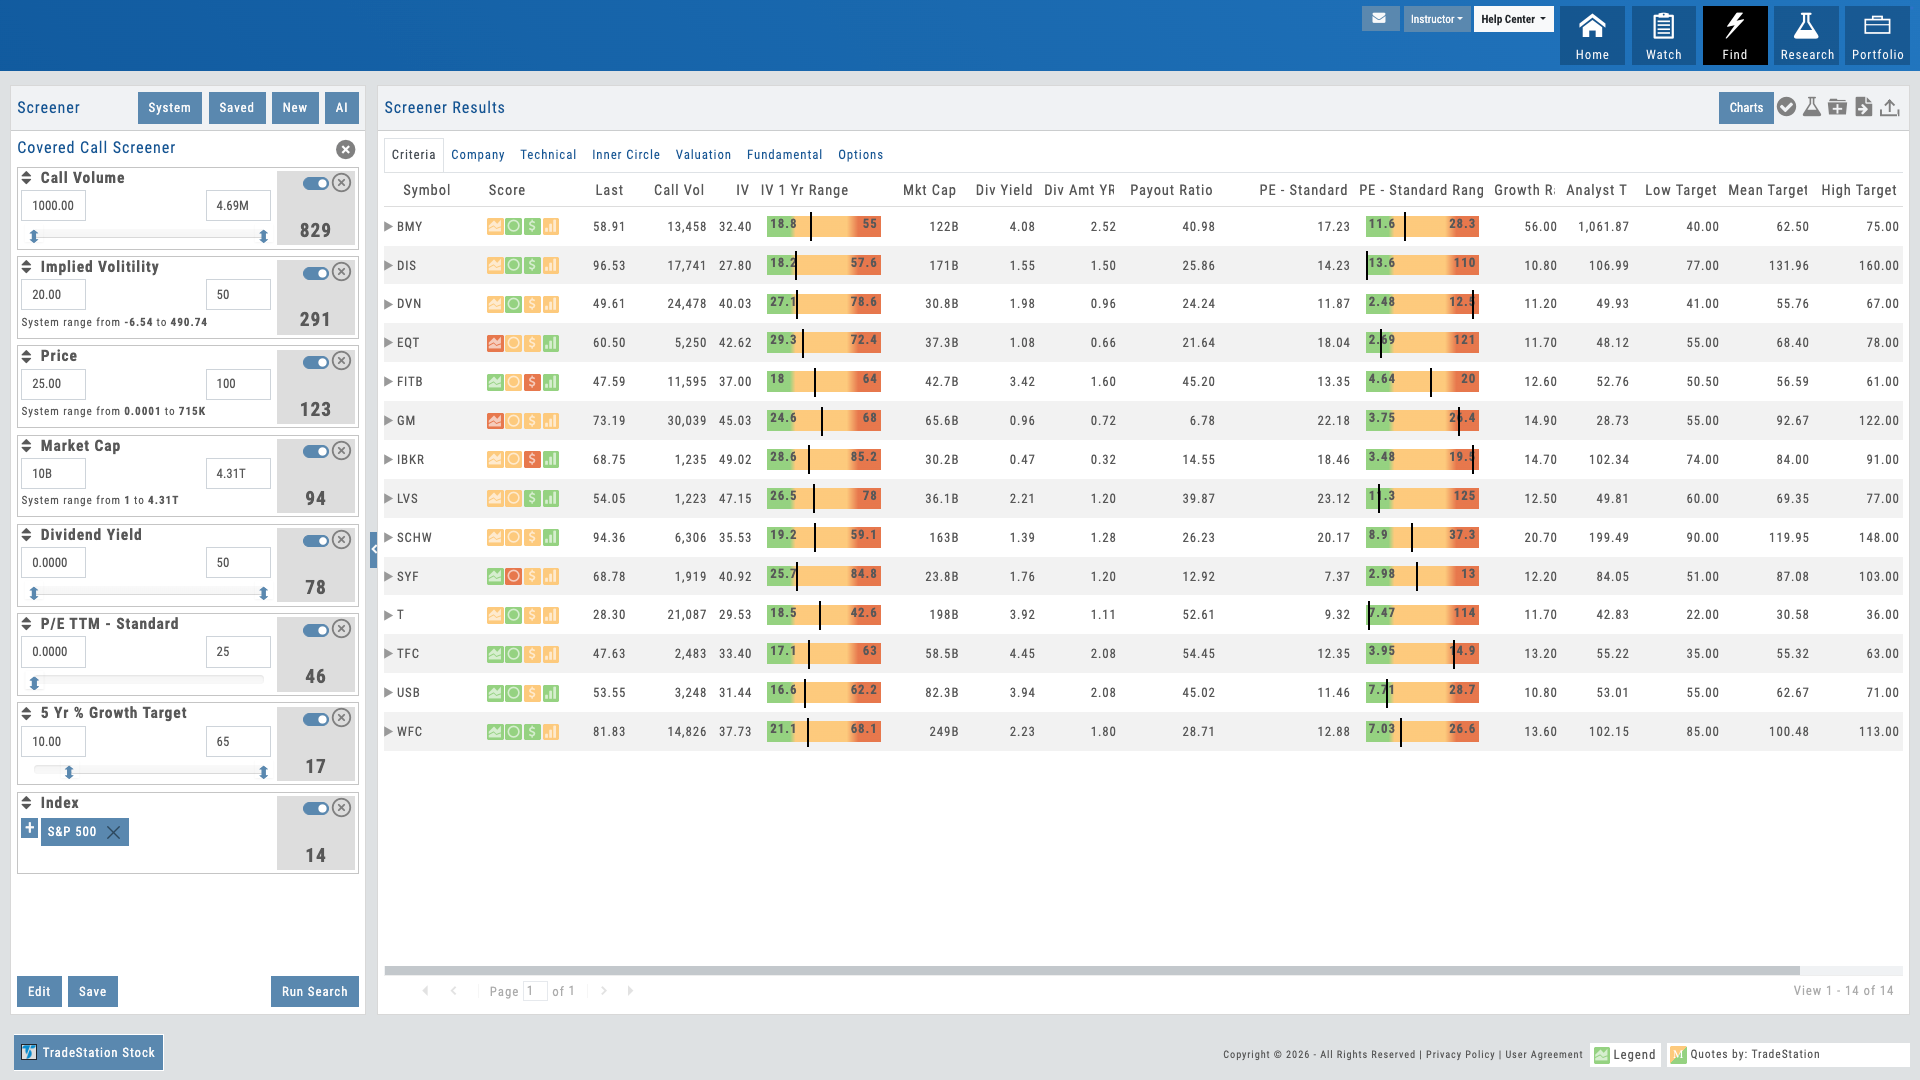
Hover over the pulsing dots to explore features
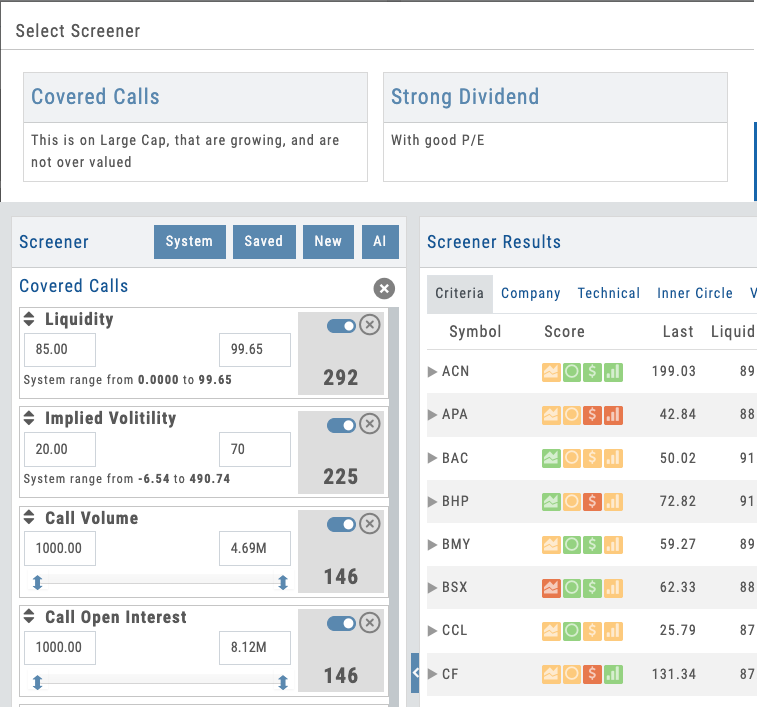
01 — Core Filtering
400+ Data Points with Progressive Disclosure
Technical, fundamental, and options criteria. Depth without overwhelm.
The screener gives you access to 400+ data points across 25,000+ stocks — spanning technical indicators, fundamental metrics, and options-specific criteria. The depth is organized into tiers so users aren’t overwhelmed: Level 1 delivers the most common screening criteria for fast filtering, while Level 3 unlocks the full 400+ data points for advanced users who want institutional-grade precision. Progressive disclosure reveals detail as they drill deeper — start with simple filters like price, market cap, and volume, then go as deep as insider trading activity, analyst sentiment, earnings surprise history, IV percentile, Greeks, and dozens more.
Multiple input types adapt to the data: sliders for ranges, checkboxes for categories, dropdowns for predefined sets, manual entry for exact values. Users control how deep they go. New traders find what they need fast. Advanced traders get the precision they demand. And everything is searchable — type a metric name and the screener finds it.
- Technical criteria: moving averages, momentum, volatility, and more
- Fundamental metrics: earnings, revenue, valuation, insider activity
- Options filters: IV percentile, volume, bid-ask spreads, Greeks
- Progressive disclosure — simple at first, detailed as needed
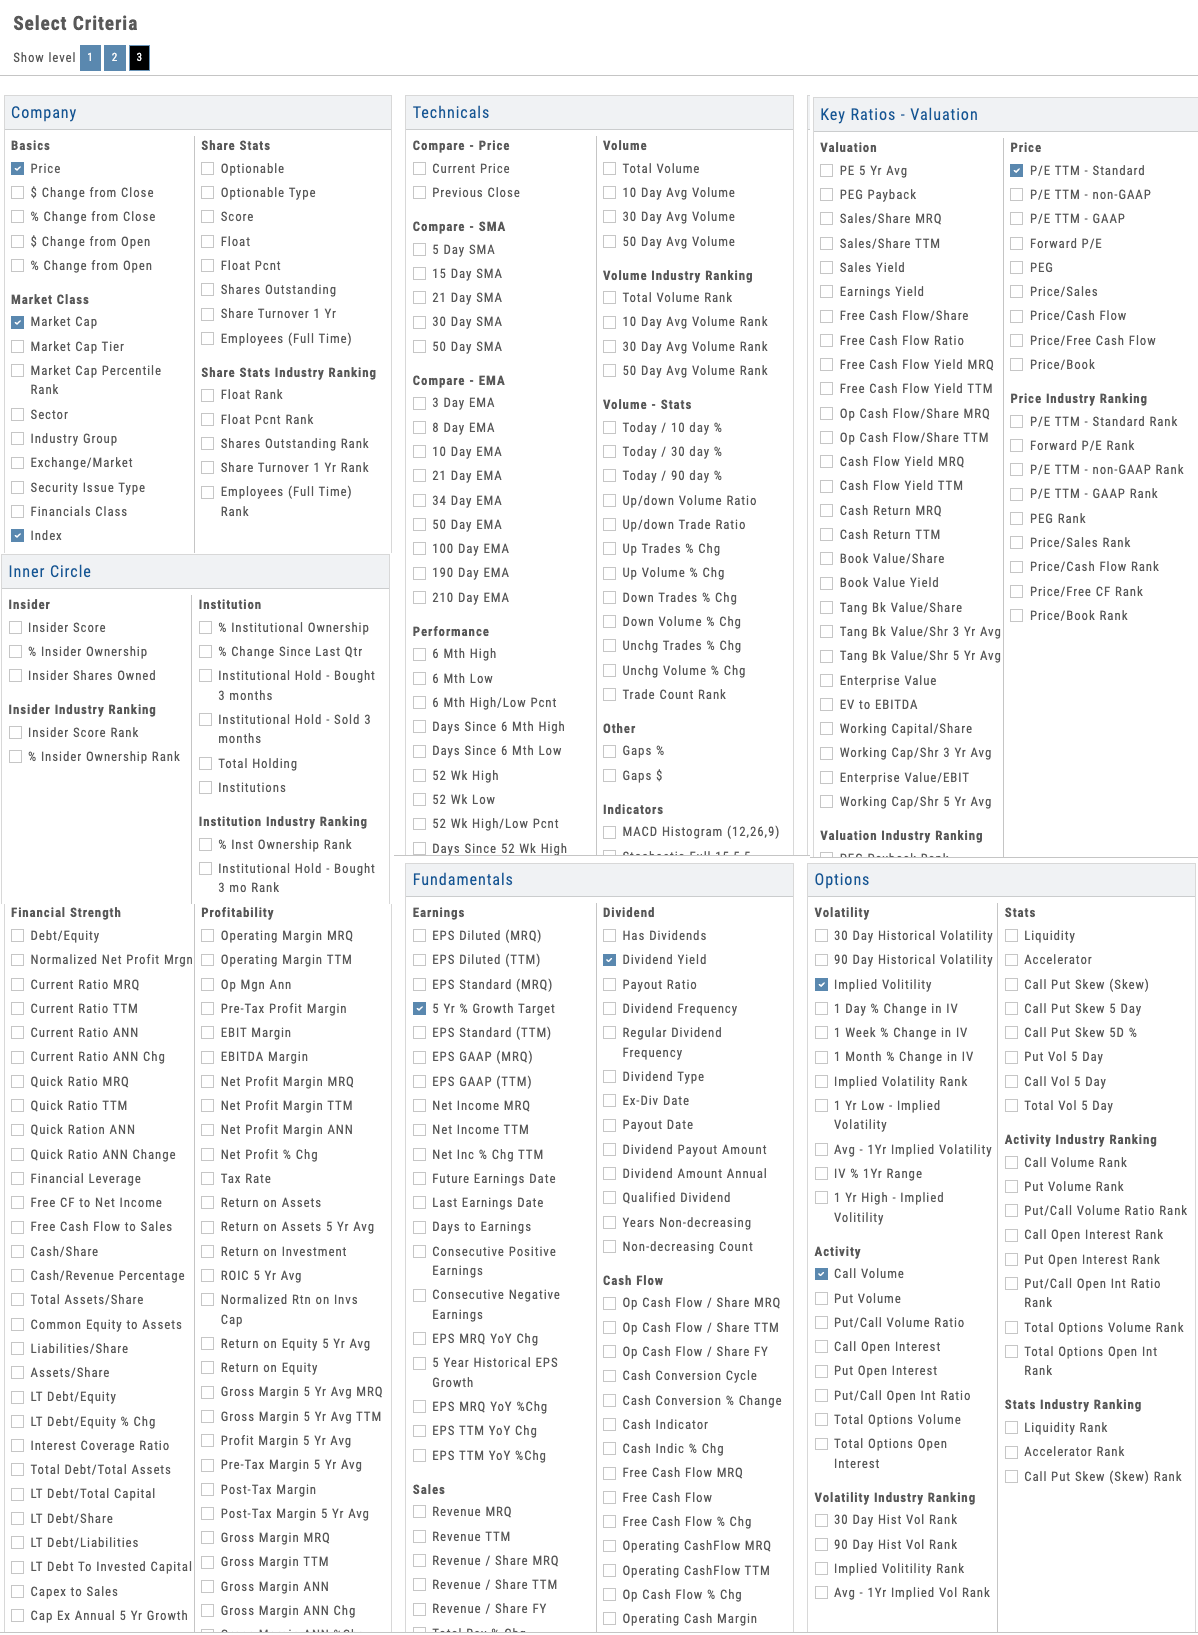
Screener with technical, fundamental, and options criteria revealed progressively
Natural Conversation
See Filtered Results in Real Time
02 — AI-Powered
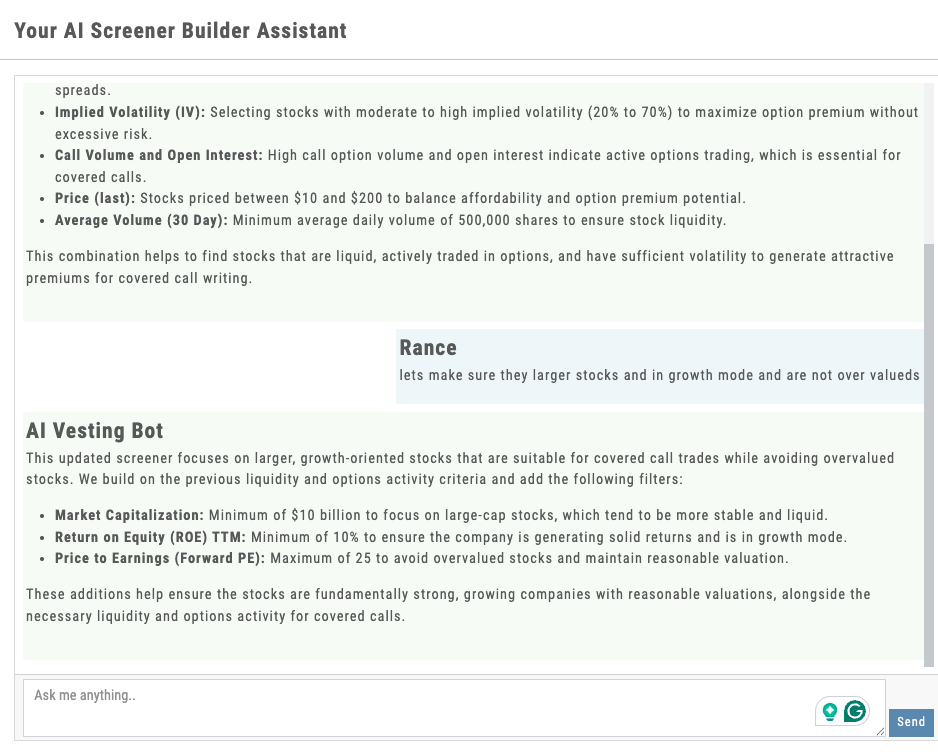
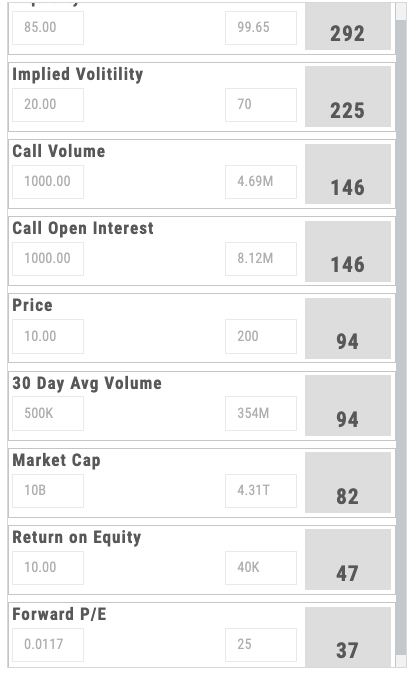
Plain-Language Screening
Describe what you’re looking for. AI translates it to filters and returns results.
Instead of clicking through a form, just tell the screener what you want: “Find me large cap tech stocks with increasing insider buying and low IV percentile.” The AI understands natural language, translates it into the right combination of filters, and runs the screen instantly. Example queries are suggested, but users write their own — the AI adapts to their style.
This is the wow factor. It makes screening accessible to beginners (no need to understand every metric name) while being faster for experienced traders (who would rather type than click). And it’s transparent — the AI shows which filters it applied, so users learn what their criteria actually mean.
- Conversational interface — type what you’re looking for in plain English
- AI translates natural language to technical filters
- Shows applied filters so users understand the translation
- Suggested example queries for common screening patterns
03 — Options Focus
Real-Time Options Screening
Intraday IV, volume, Greeks — options-specific filters most screeners don’t offer.
Options traders need options data. The screener includes intraday IV percentile, real-time volume, bid-ask spreads, implied move, skew, and all four Greeks — updated throughout the trading day as market conditions shift. Filter for high-volume contracts, elevated IV for shorts, low spreads for entries, positive gamma setups, whatever your strategy demands.
Most screeners treat options as an afterthought. Here, they’re central. Your users can find the highest IV percentile in tech, the lowest IV in earnings plays, options with the widest volume profile, or setups that match their edge. It’s real-time, it’s deep, and it’s built for the people who actually trade options.
- Intraday IV percentile and implied move
- Real-time volume, open interest, bid-ask data
- Greeks — delta, gamma, theta, vega filtering
- Earnings-sensitive IV metrics and volatility smile data
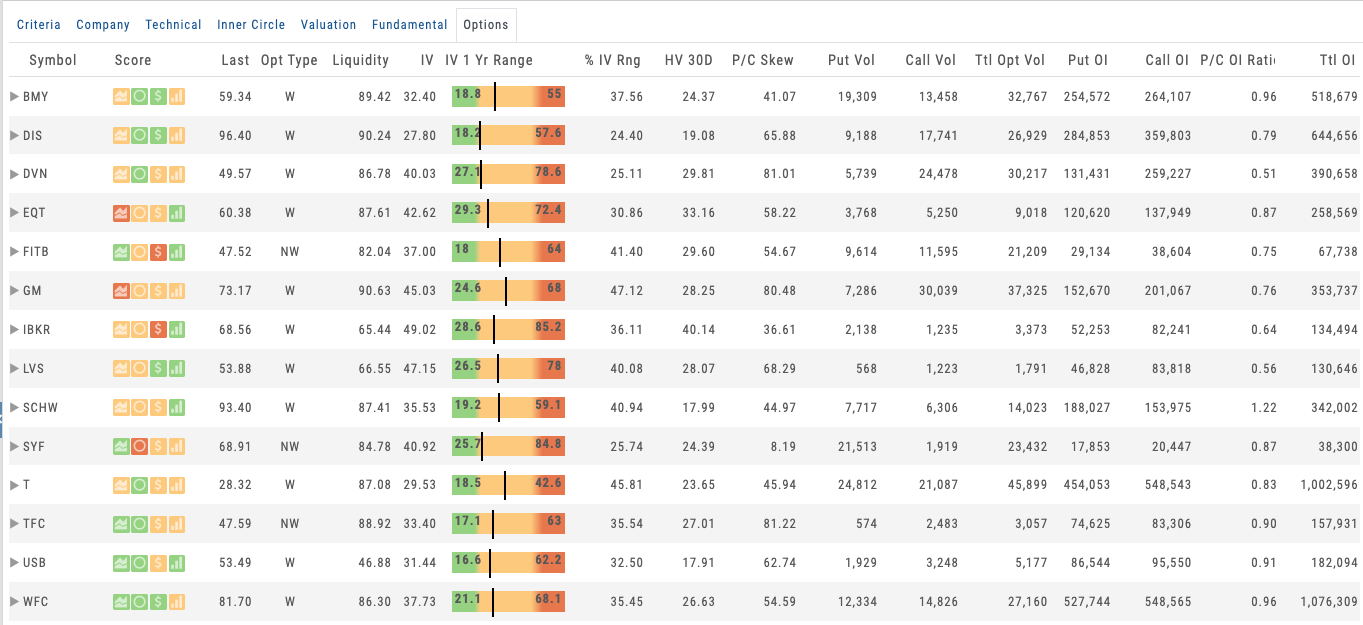
Options screener showing IV percentile, Greeks, and volume columns with real-time updates
Want to Give Your Users the Deepest Screener Available?
400+ data points, progressive disclosure, AI-powered screening, and real-time options data — deployed as part of your branded platform.
Screen library showing partner-prefixed defaults and user-created screens with save/share options
04 — Partner Control
Save, Share & Pre-Build Screens
Partners create default screens. Students start with curated discovery, not a blank slate.
Every screen can be saved for instant reuse. Users build custom screens and name them — they become part of their personal toolkit. But here’s the partner lever: use the Admin Account to pre-build default screens and push them to every user on your platform.
When a new student logs in, they don’t see a blank screener. They see a curated set of screens you’ve created — perhaps “Earnings Surprises,” “High IV Plays,” “Blue Chip Dividend Growers,” or “LEAPS with Liquidity.” They start with guided discovery. They can modify your screens, save their own variants, and gradually build expertise. Screens are prefixed with [S] for your defaults, so they’re always distinct from user creations.
- Save and name unlimited custom screens for instant reuse
- Admin Account creates default screens pushed to all users
- Share screens with comments — collaborate on strategy discovery
- Prefix-based organization ([S] tags) for defaults vs. user screens
The Deepest Screener, Under Your Name
400+ data points across 25,000+ stocks, tiered depth from beginner to advanced, AI-powered plain-language screening, real-time options data, and Admin Account control — all deployed as part of your branded screening platform. Your users get institutional-grade filtering. You get a retention lever that keeps them coming back.
Connects to leading brokerages including Schwab, Tradier, and more. See all supported brokers →