

Heatmap Module
The Entire Market, One View
S&P sectors color-coded by performance. Drill from index to sector to industry to stock in one click. Size represents market cap. Multiple timeframes: 1D, 1W, 1M, 3M, YTD, 1Y. The perfect starting point for market discussion — open the heatmap and teach from what’s happening now.
Heatmap Module
Interactive Guide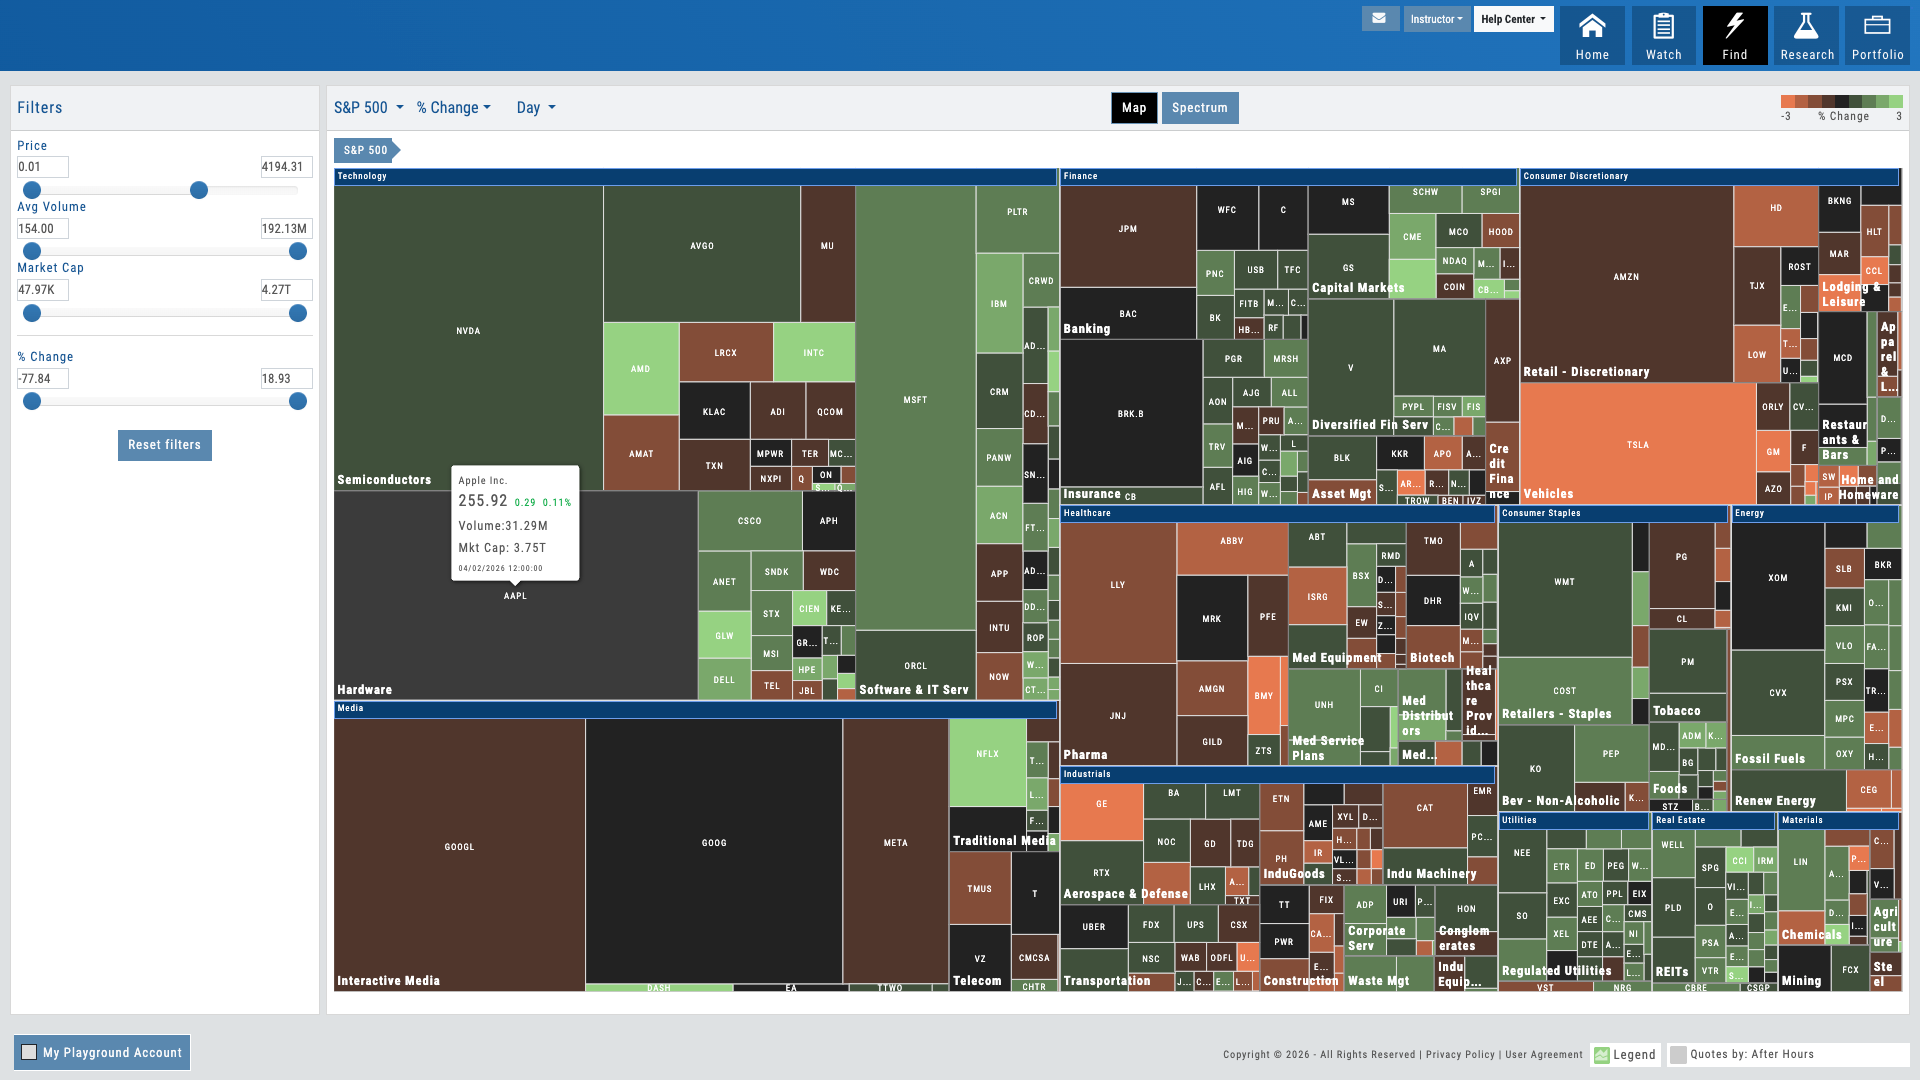
01 — Market Discovery
Drill Down from Market to Stock
Click a sector, see industries. Click an industry, find the stocks driving performance. Size represents market cap, color represents performance.
The heatmap is discovery. Instead of searching for what’s moving, users see the entire market at once — every sector, every industry, every stock — organized by structure and colored by performance. Red to green gradients make winners and losers instant. Market cap determines block size so users see where the volume is.
For educators, this is how market lessons begin. Open the heatmap and ask: “What’s green today and why?” Students drill down, spot patterns across sectors, and develop market intuition. The heatmap transforms passive screen-watching into active market exploration.
Multiple timeframes — 1D, 1W, 1M, 3M, YTD, 1Y — let users zoom out and see seasonal patterns or zoom in and see intraday movers. One click moves from broad market view to a single stock ready for deeper analysis.
- S&P 500 sectors color-coded by performance — red to green gradient
- Drill down: sector → industry → individual stocks
- Block size represents market cap — see where the volume is at a glance
- 6 timeframes: 1D, 1W, 1M, 3M, YTD, 1Y — spot intraday moves or seasonal patterns
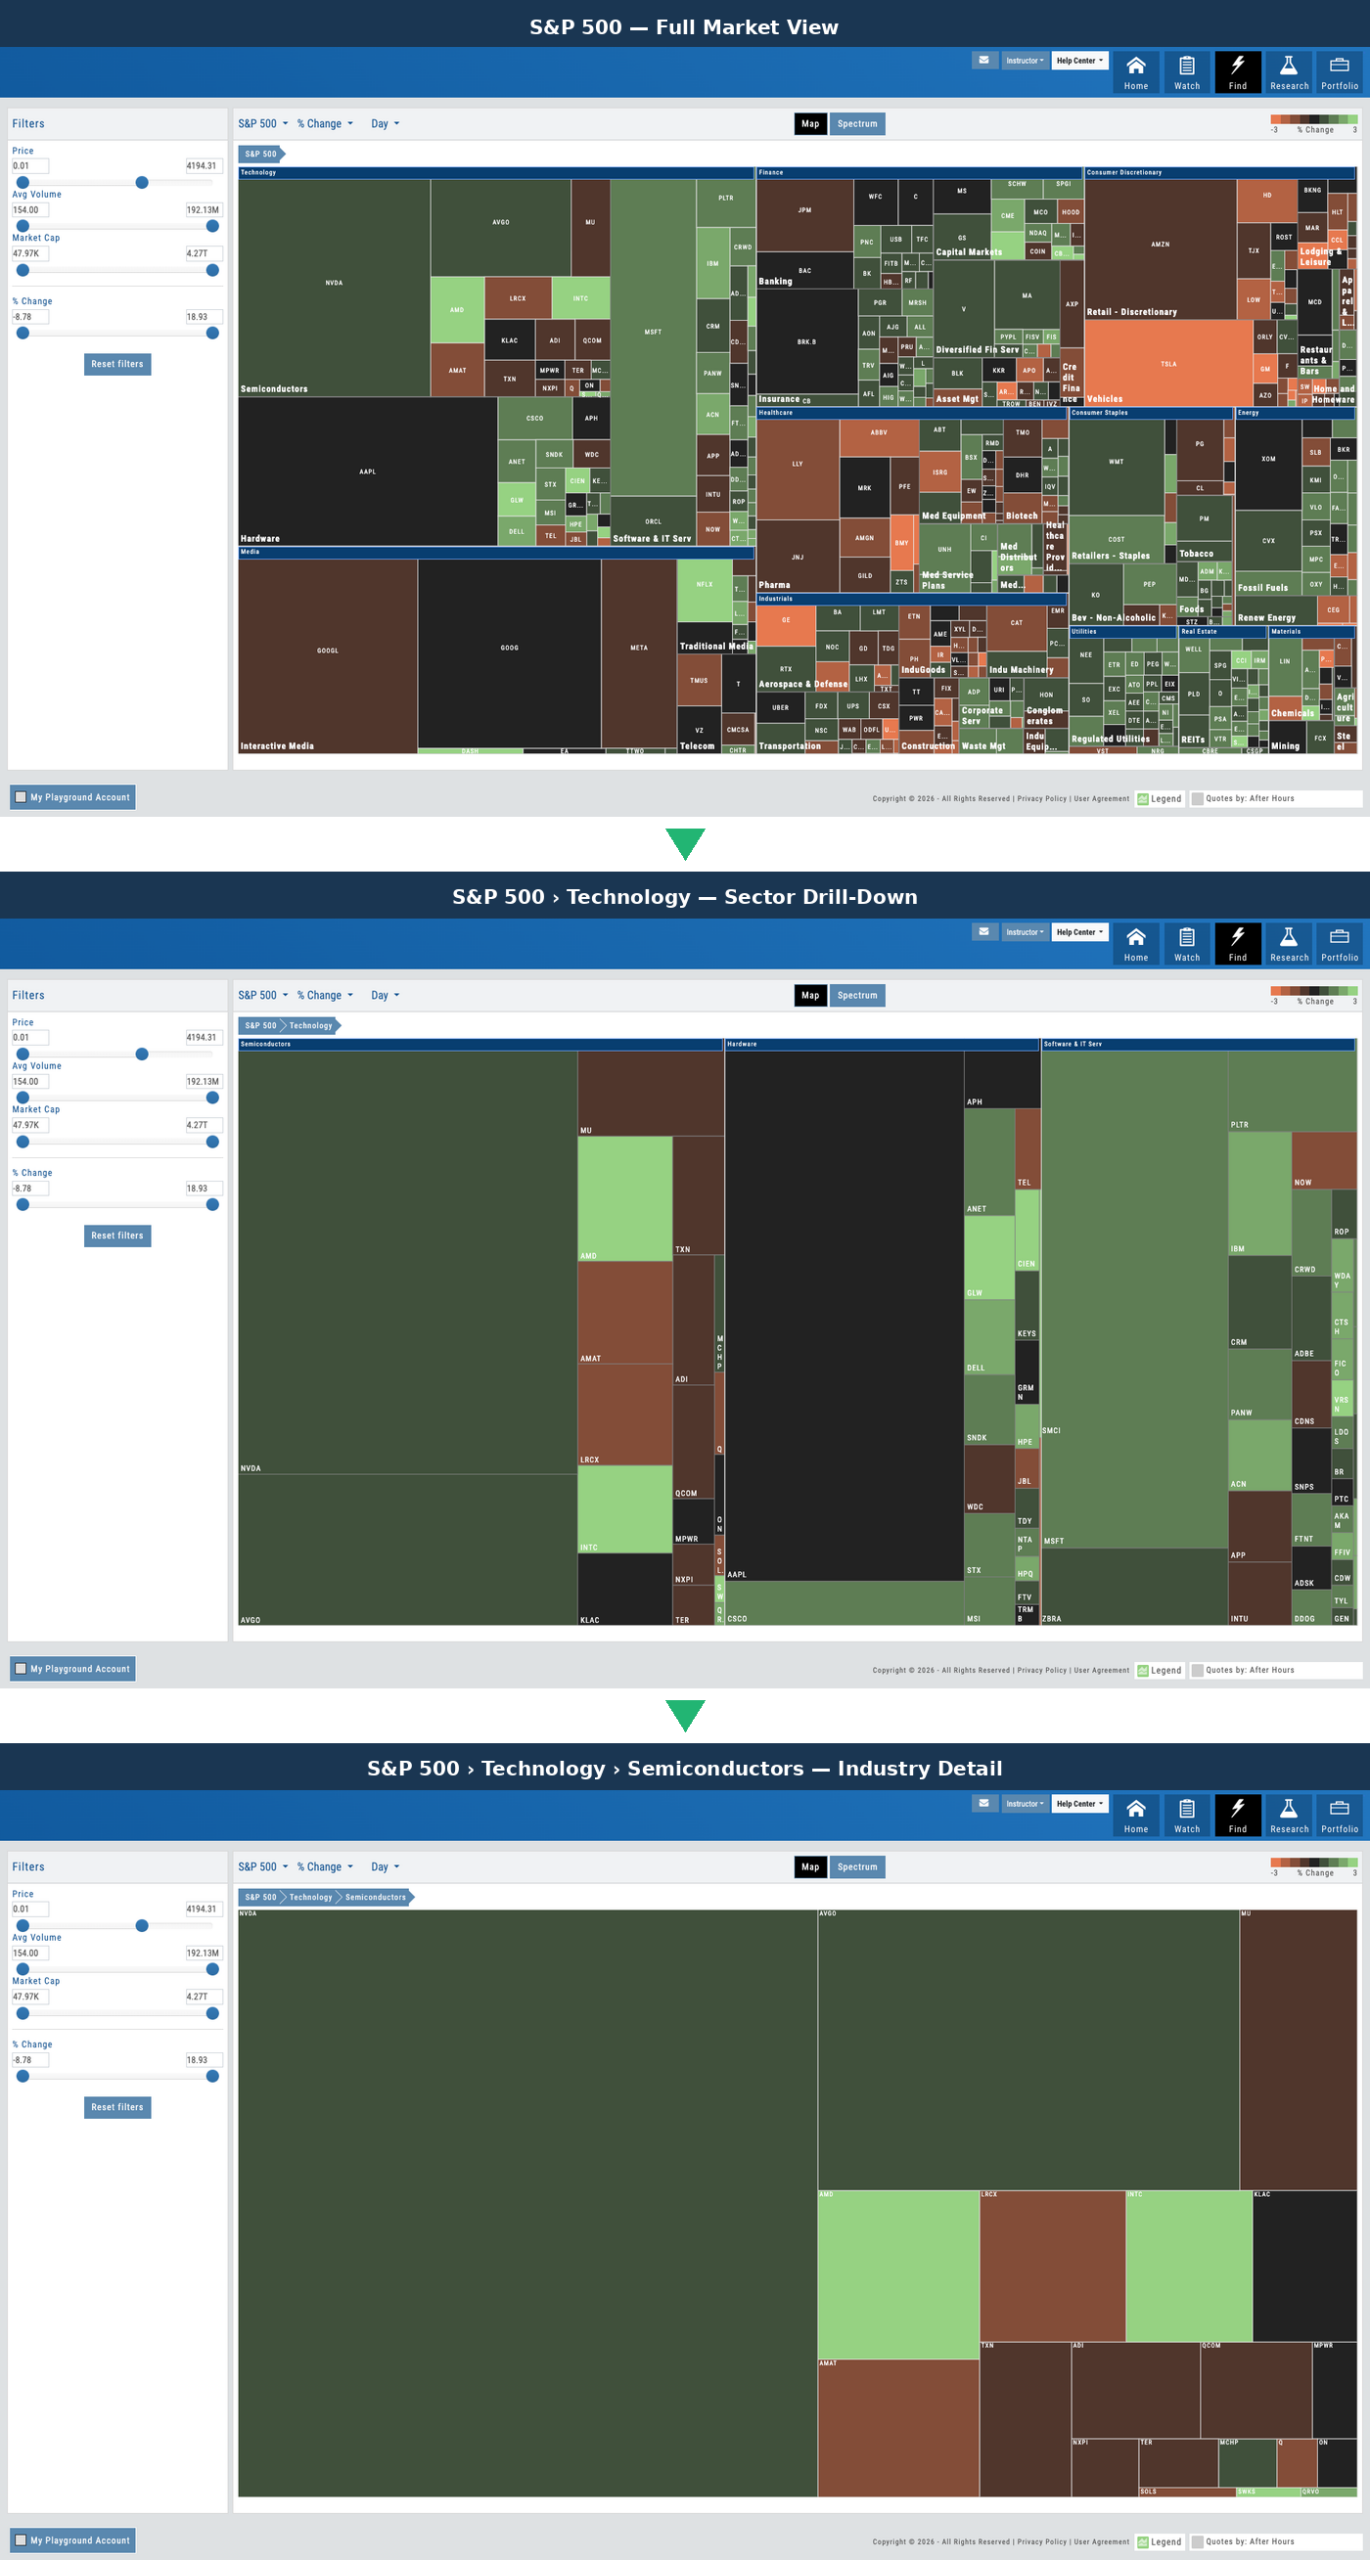
Progression from full market heatmap to sector view to individual stocks
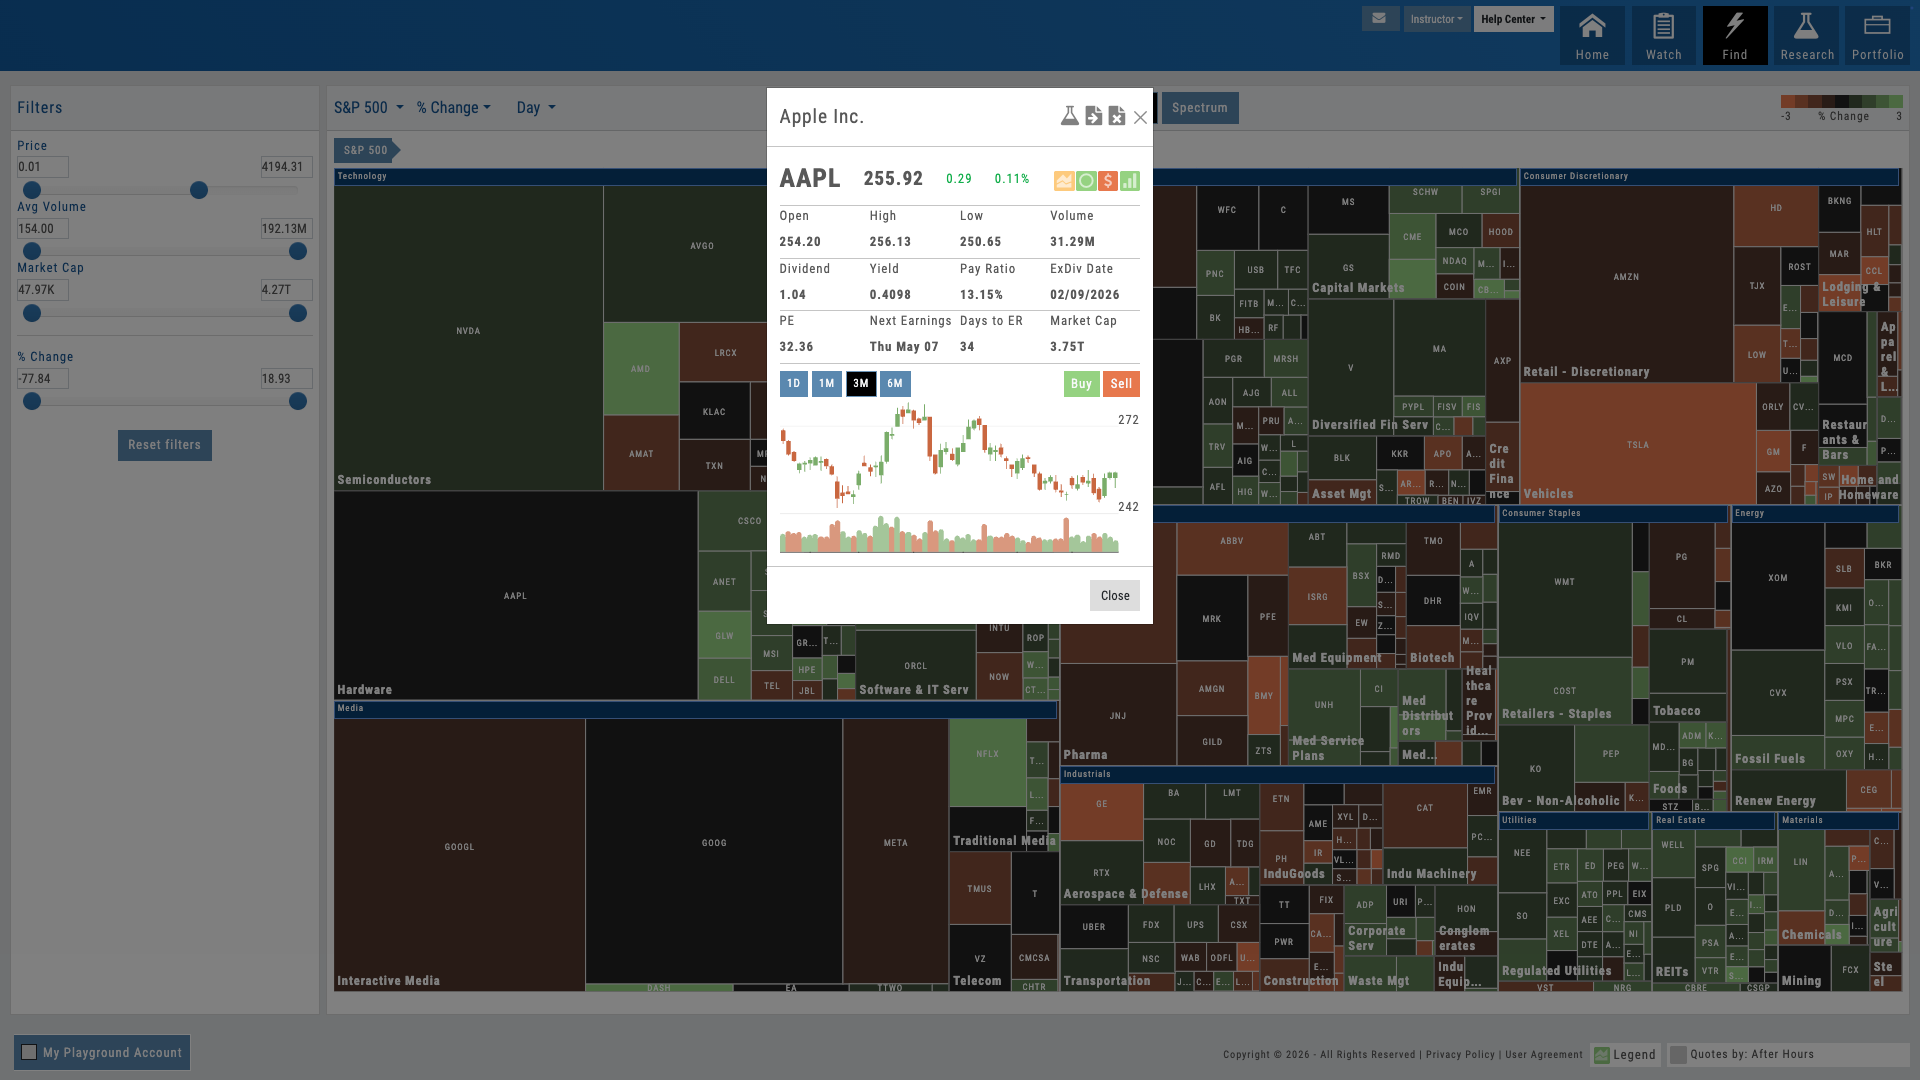
Stock selected on heatmap, Research Dashboard opens with proprietary scores
02 — Workflow Continuity
One Click to Research
Find a stock on the heatmap. Click it. Land in the Research Dashboard with all four proprietary scores loaded.
Discovery should lead to effortless analysis. Click any stock on the heatmap and jump directly to the Research Dashboard — where all four proprietary scores are already calculated and waiting. No separate login. No duplicate searches. The workflow is seamless: discover on the heatmap, research in the dashboard, chart on the platform, trade when ready.
For educators, this continuous workflow teaches students the research process: market context first, then fundamentals, then technicals, then execution. The heatmap is the entry door. Everything else flows from one click.
- Click any stock on the heatmap → jump to Research Dashboard
- Four proprietary scores pre-loaded: Growth, Value, Quality, Momentum
- No duplicate work, no context switching — stay in one platform
- Research → Chart → Trade — continuous workflow under your brand
Want Your Students to Start Every Session with Market Context?
The heatmap is your market discovery tool — deployed as part of your branded platform.
03 — Market Intelligence
Multiple View Modes
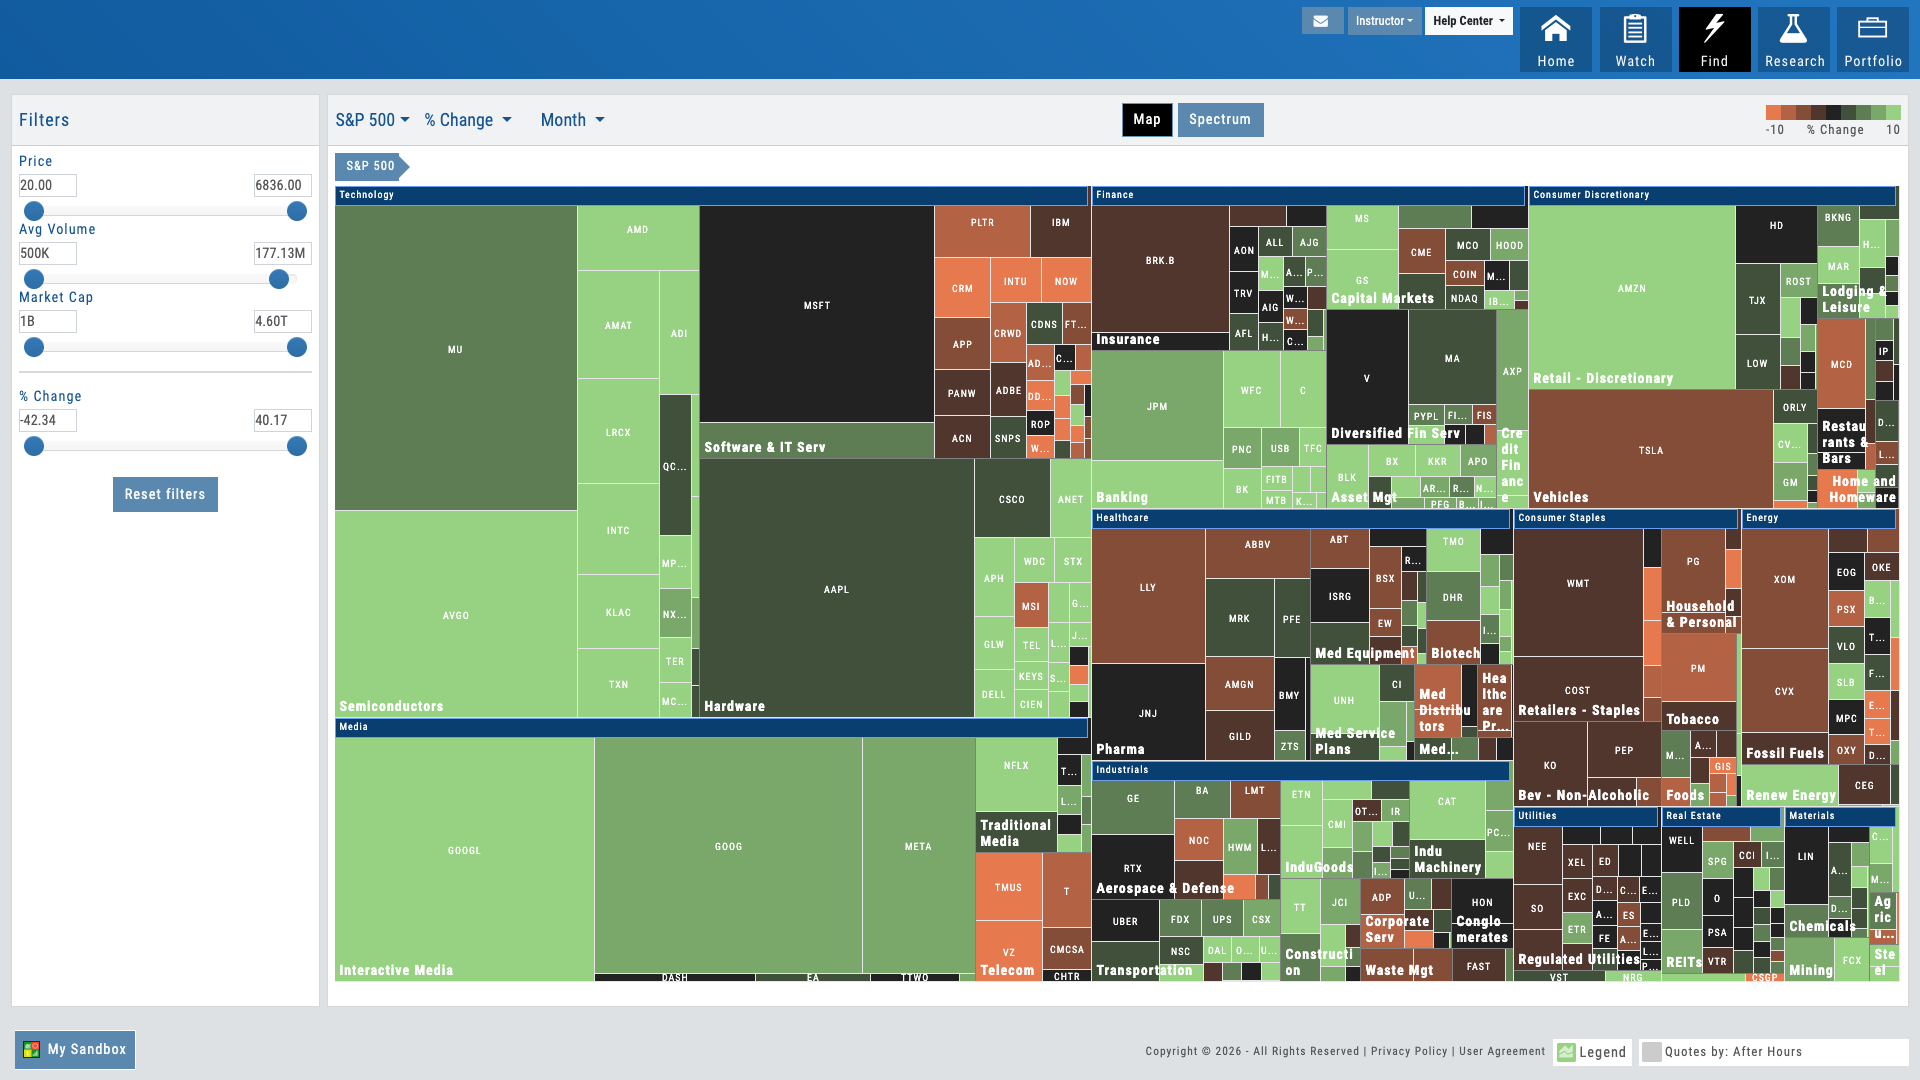
Same structure, different metrics. View performance, volume, or other market drivers — all in one click.
The heatmap isn’t limited to performance. Toggle between view modes to see the market through different lenses: performance shows winners and losers; volume shows where the action is; other metrics reveal divergences and opportunities. The visual structure stays consistent — sectors and industries in the same hierarchical layout — but the meaning of color and size changes with each view.
For traders, this teaches pattern recognition across market dimensions. For educators, it’s a teaching accelerator: “Why is this stock red on performance but blue on volume?” The heatmap makes these questions visual and immediate.
- Performance view — red to green gradient showing winners and losers
- Volume view — block size shows trading activity and liquidity
- Additional metrics — IV, moving averages, or other market drivers
- Consistent structure across all views — learn once, explore many ways
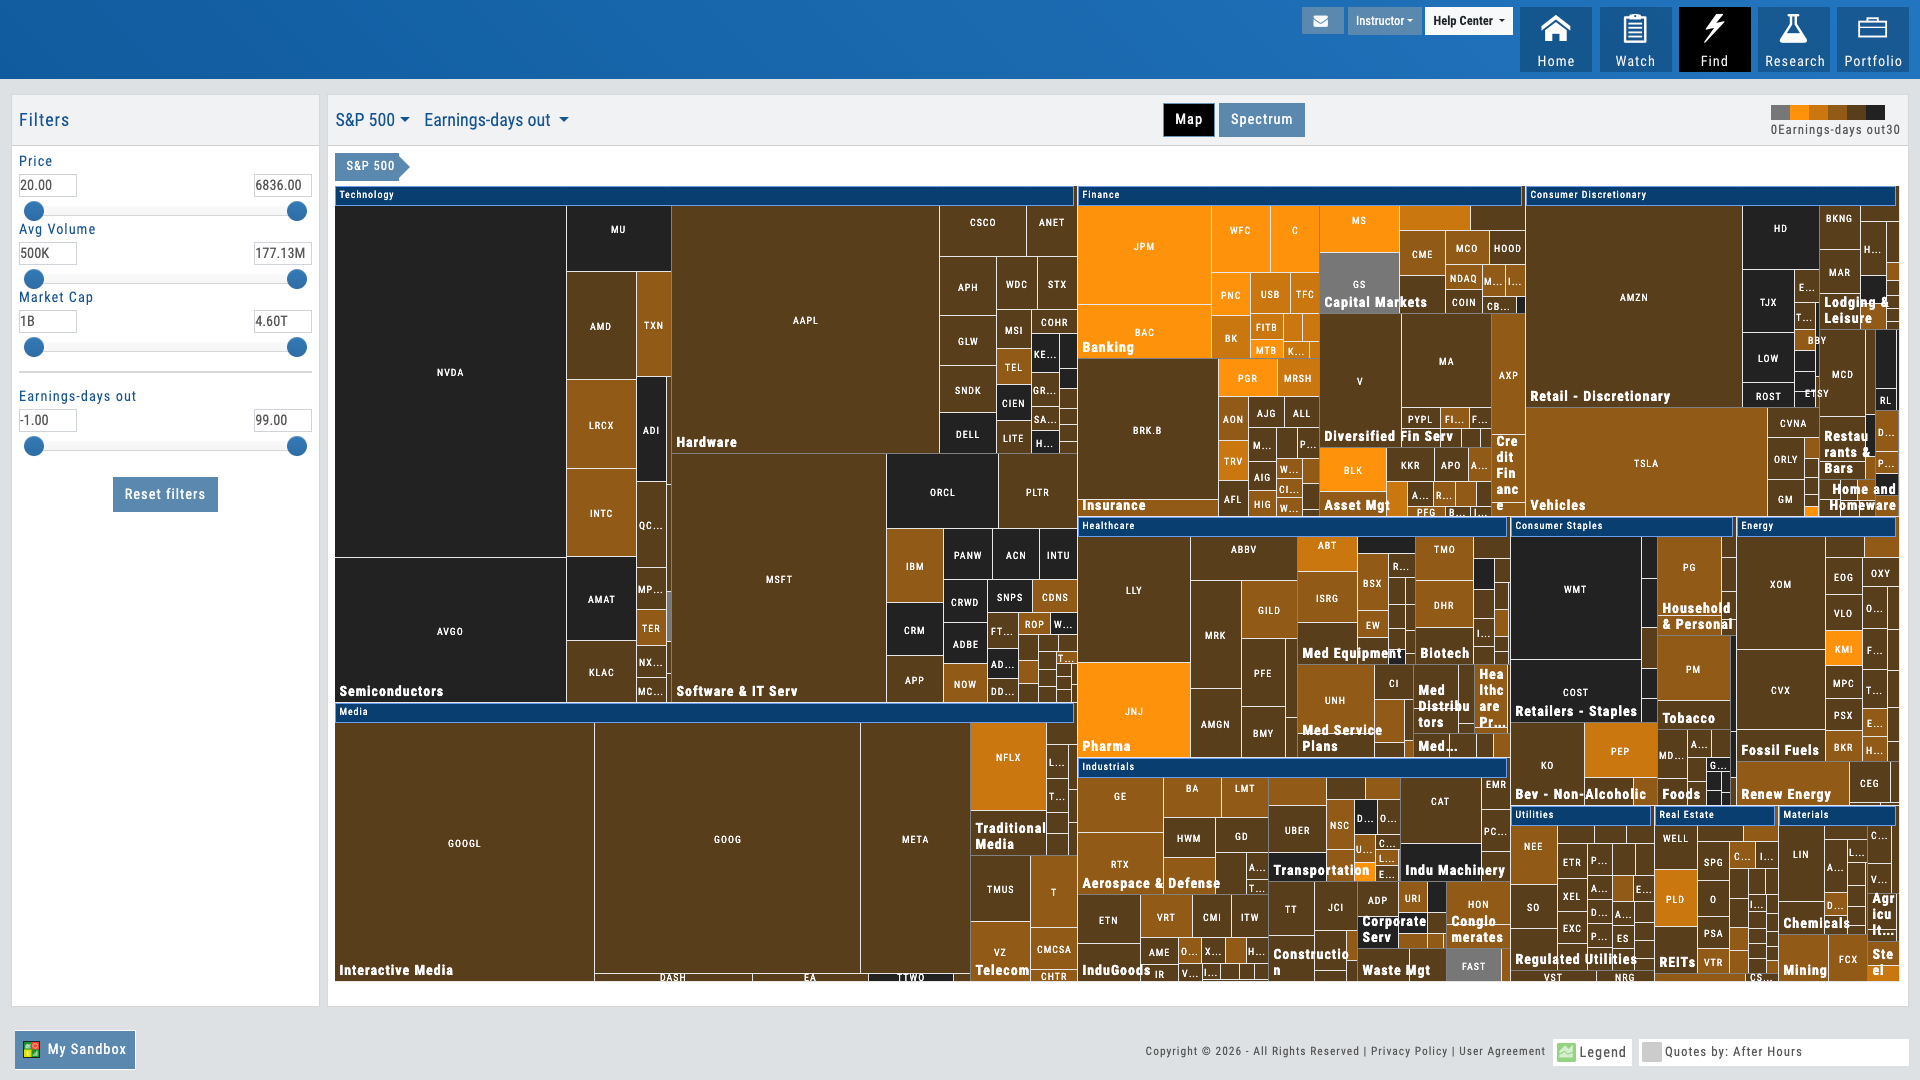
Percent Change With Variable Timeframe
Days Until Earnings
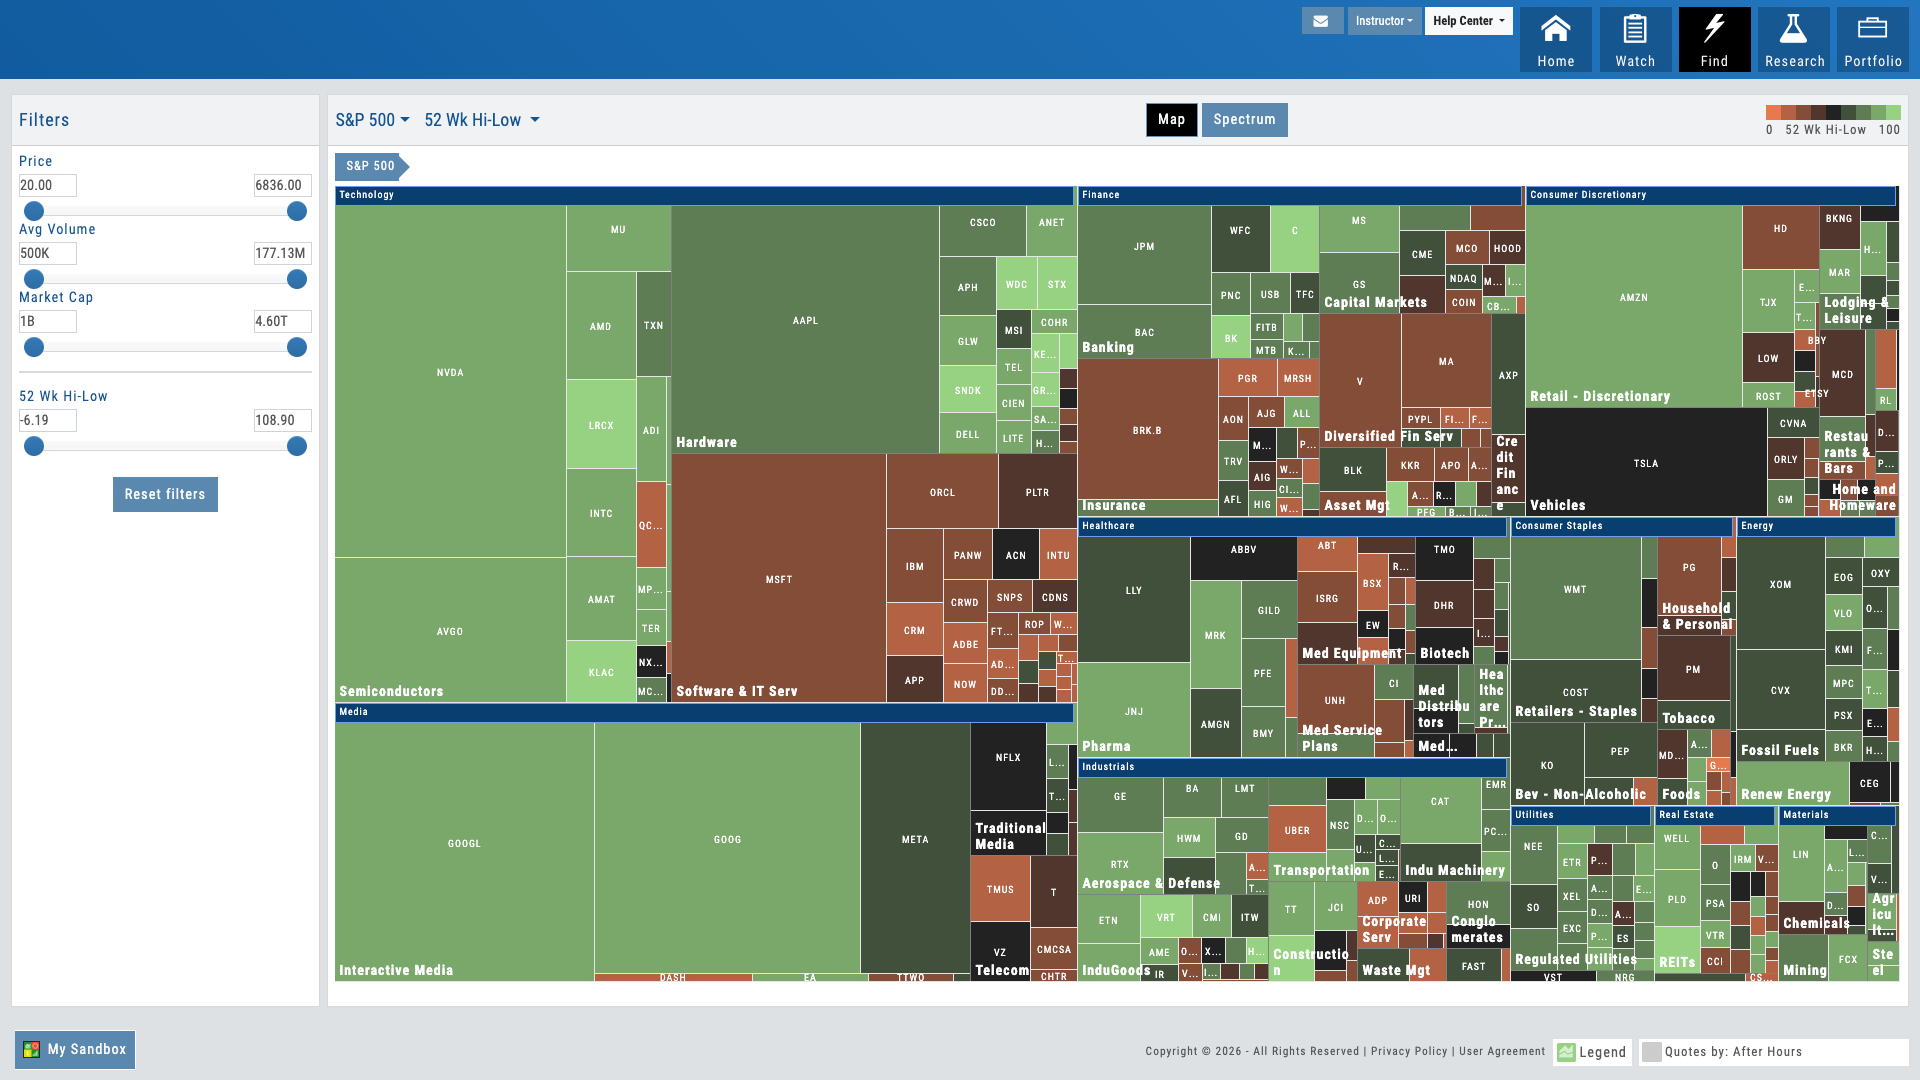
52 Week High-Low Ranking
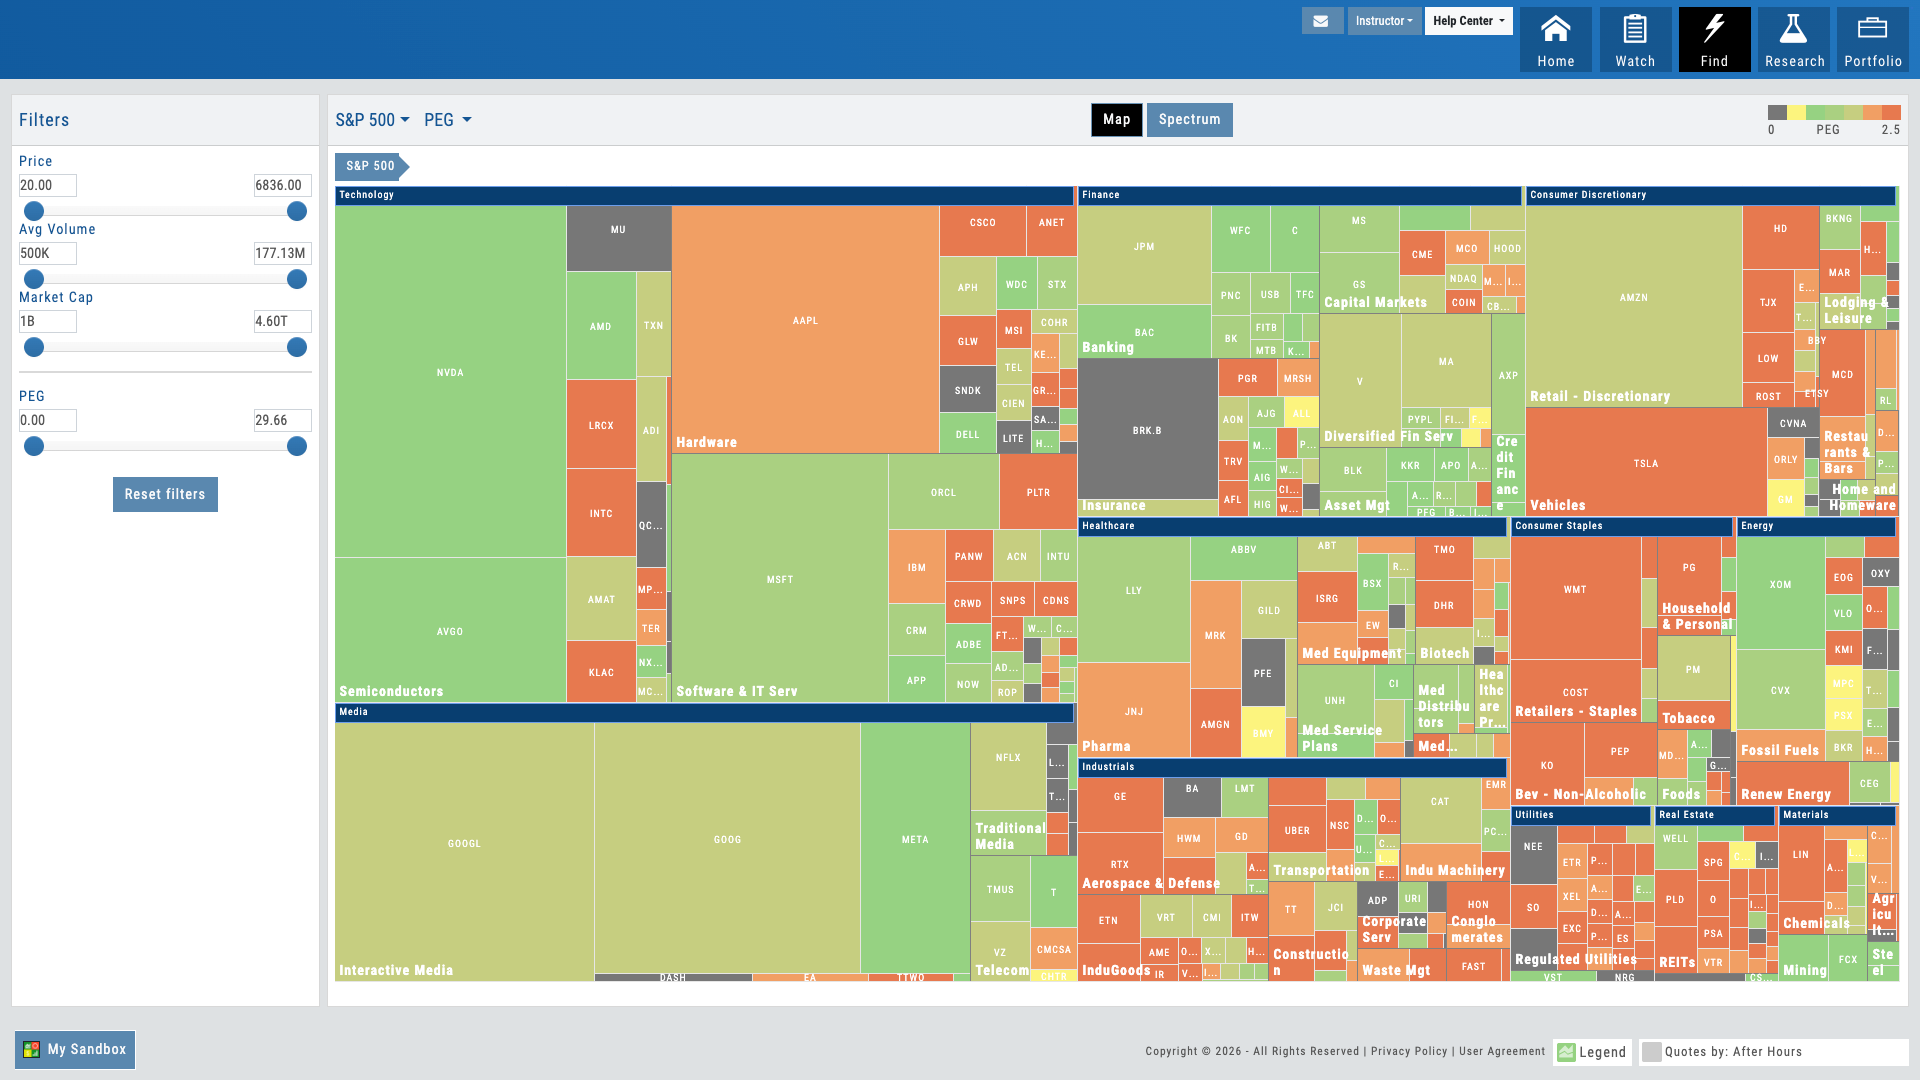
PEG Ratio — Over or Under Valued
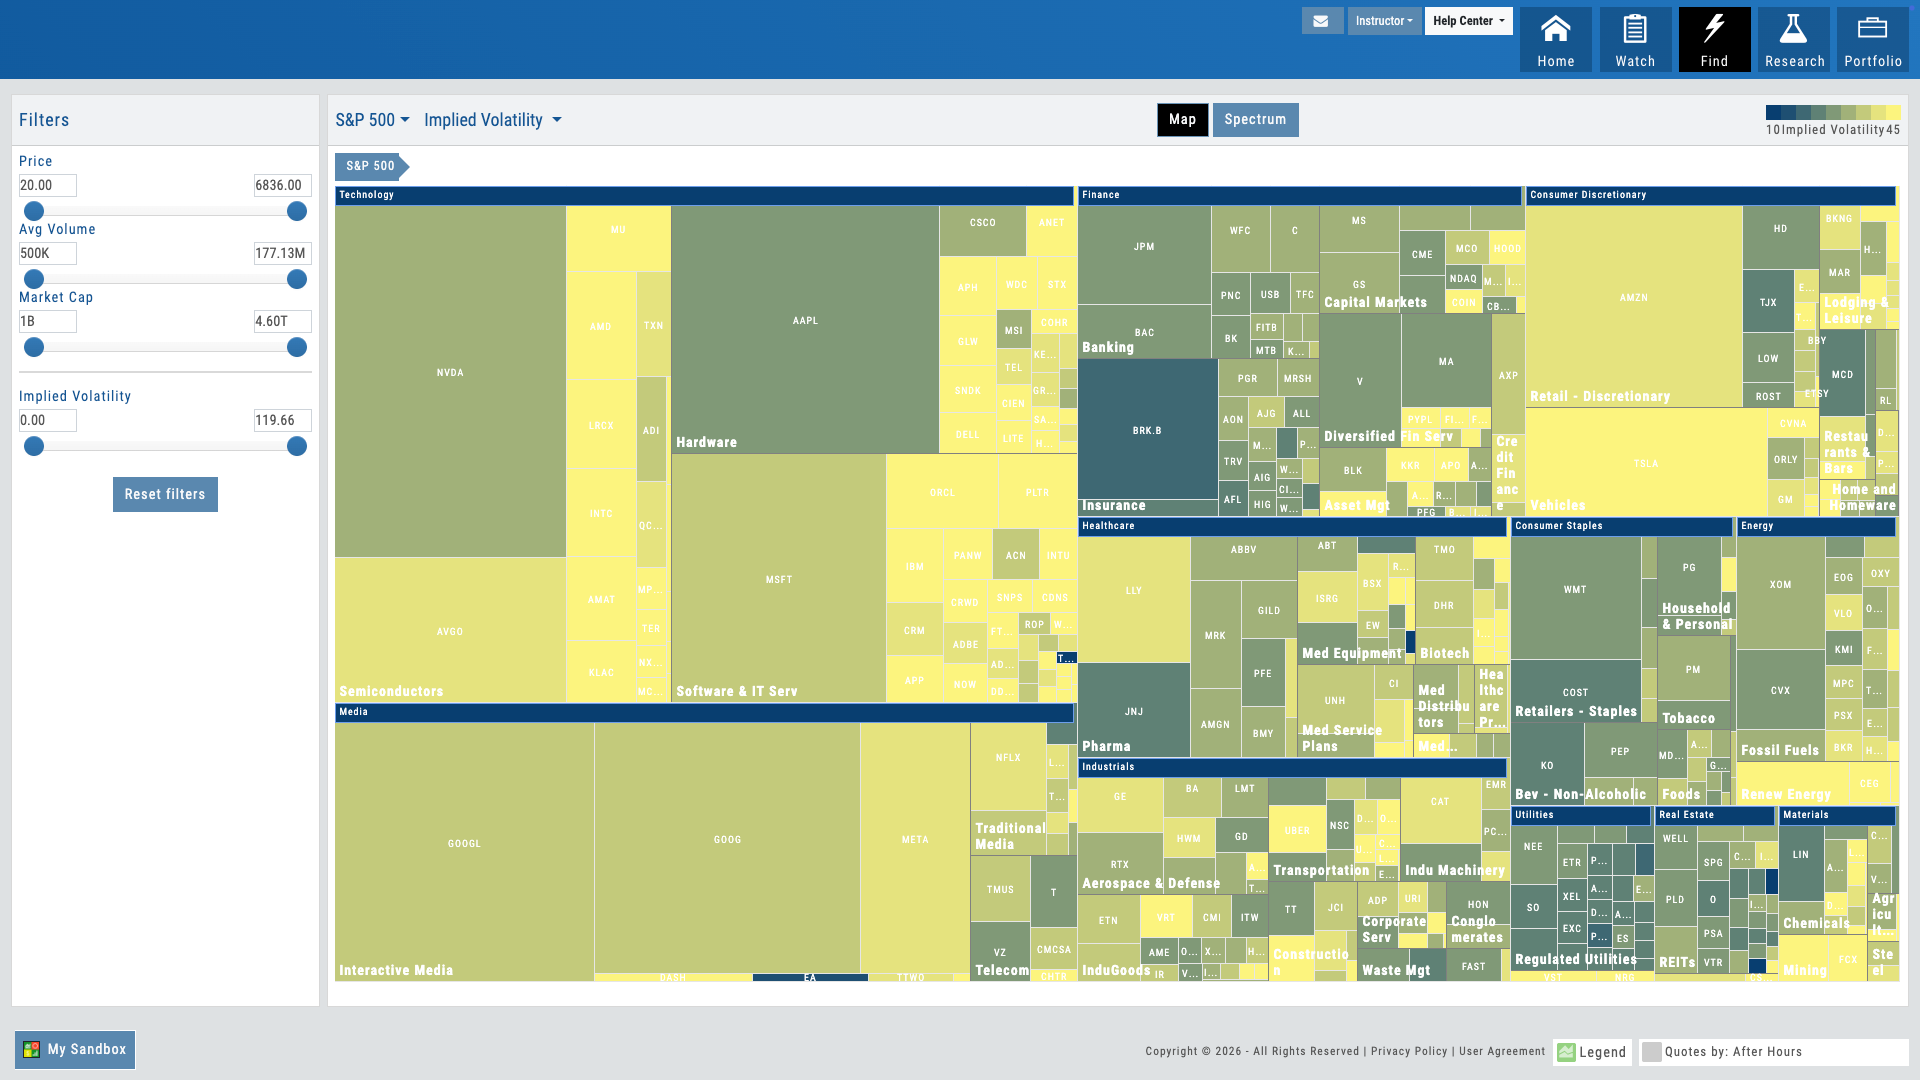
Implied Volatility
Market Discovery Under Your Brand
The heatmap is where exploration begins — full market at a glance, drill-down discovery, one-click research, and 8 AI-powered features across the platform. Your users start every session in context. You get a retention lever that keeps them coming back.
Connects to leading brokerages including Schwab, Tradier, and more. See all supported brokers →