

Options Module
Deepest Options Analytics with Built-In Guardrails
20 strategy templates that make options easy to understand. Every trade shows max risk, max reward, breakeven, and Greeks — with visual P&L zones right on the chart. Proprietary gauges, IV slider, 25+ years of backtesting, and trade management tools. All under your brand.
Options Module
Interactive Guide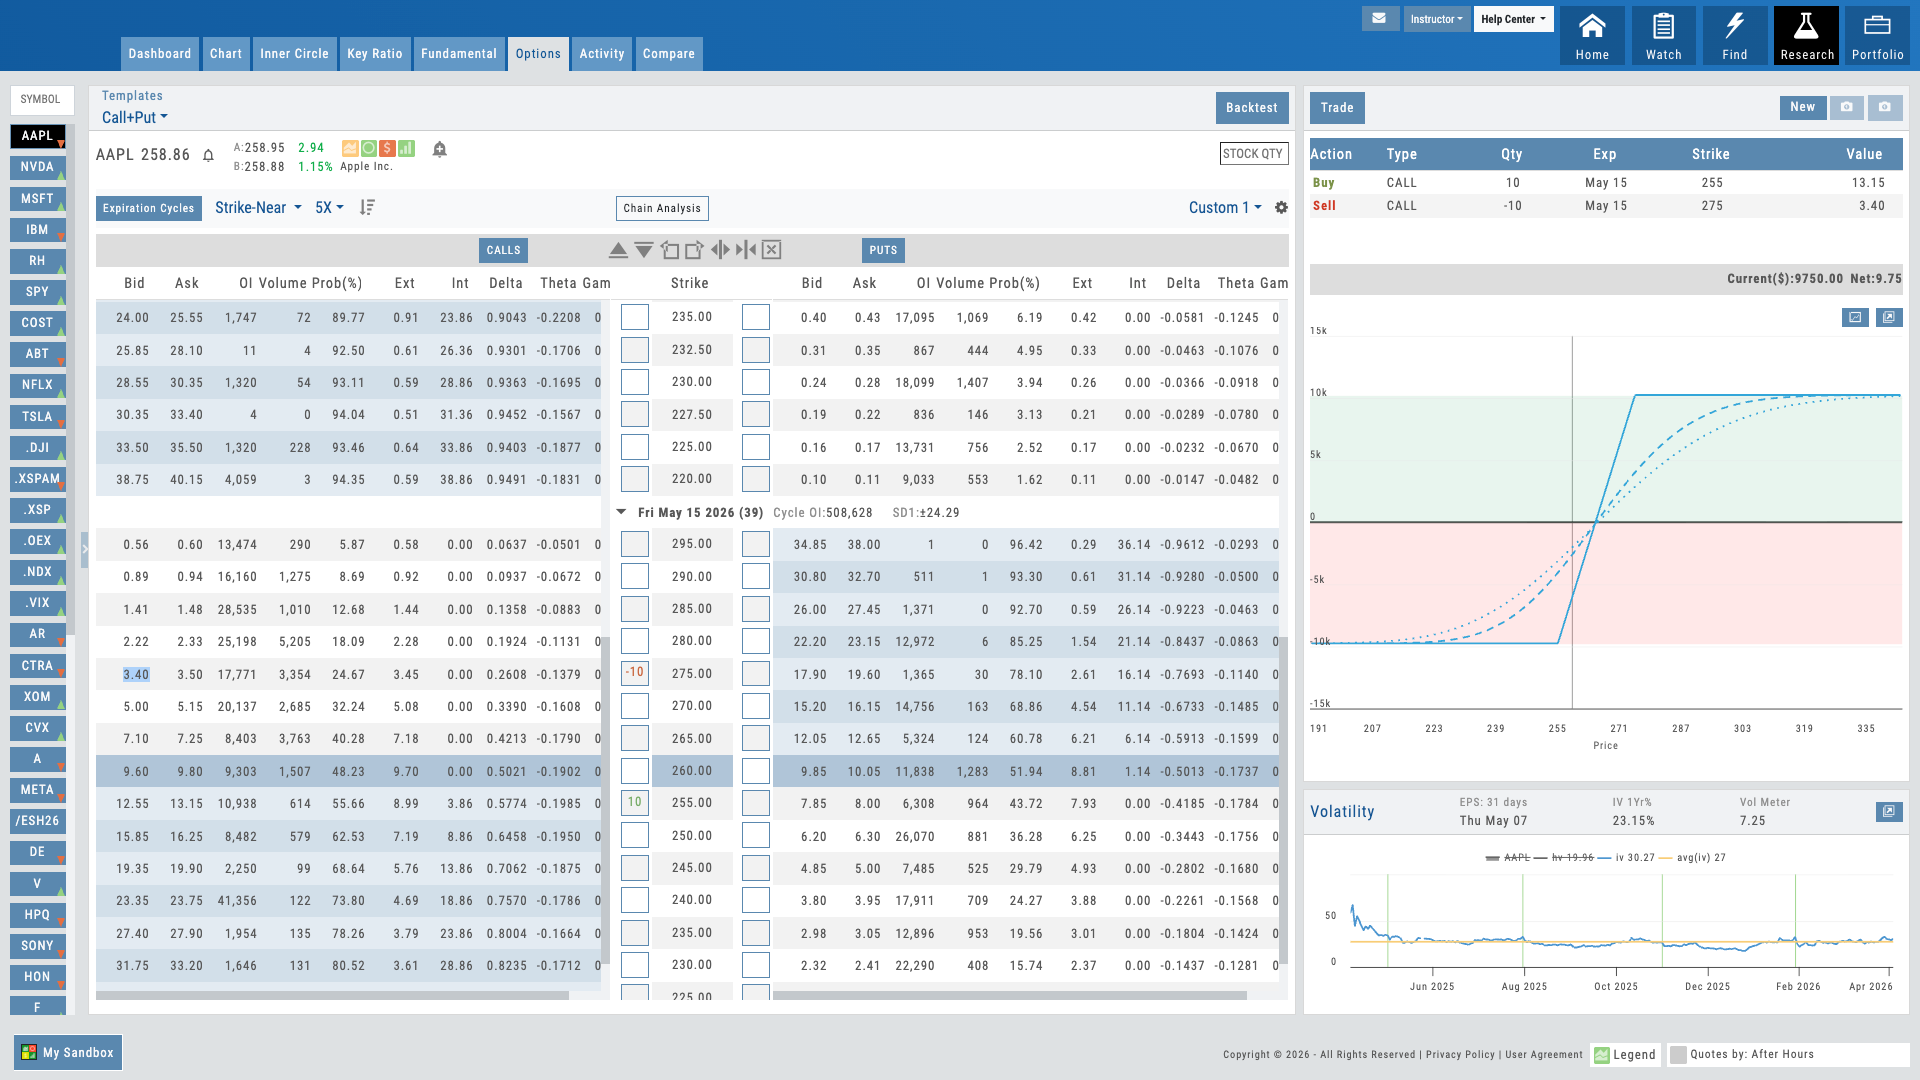
Hover over the pulsing dots to explore features
Options Trade Builder
Interactive Guide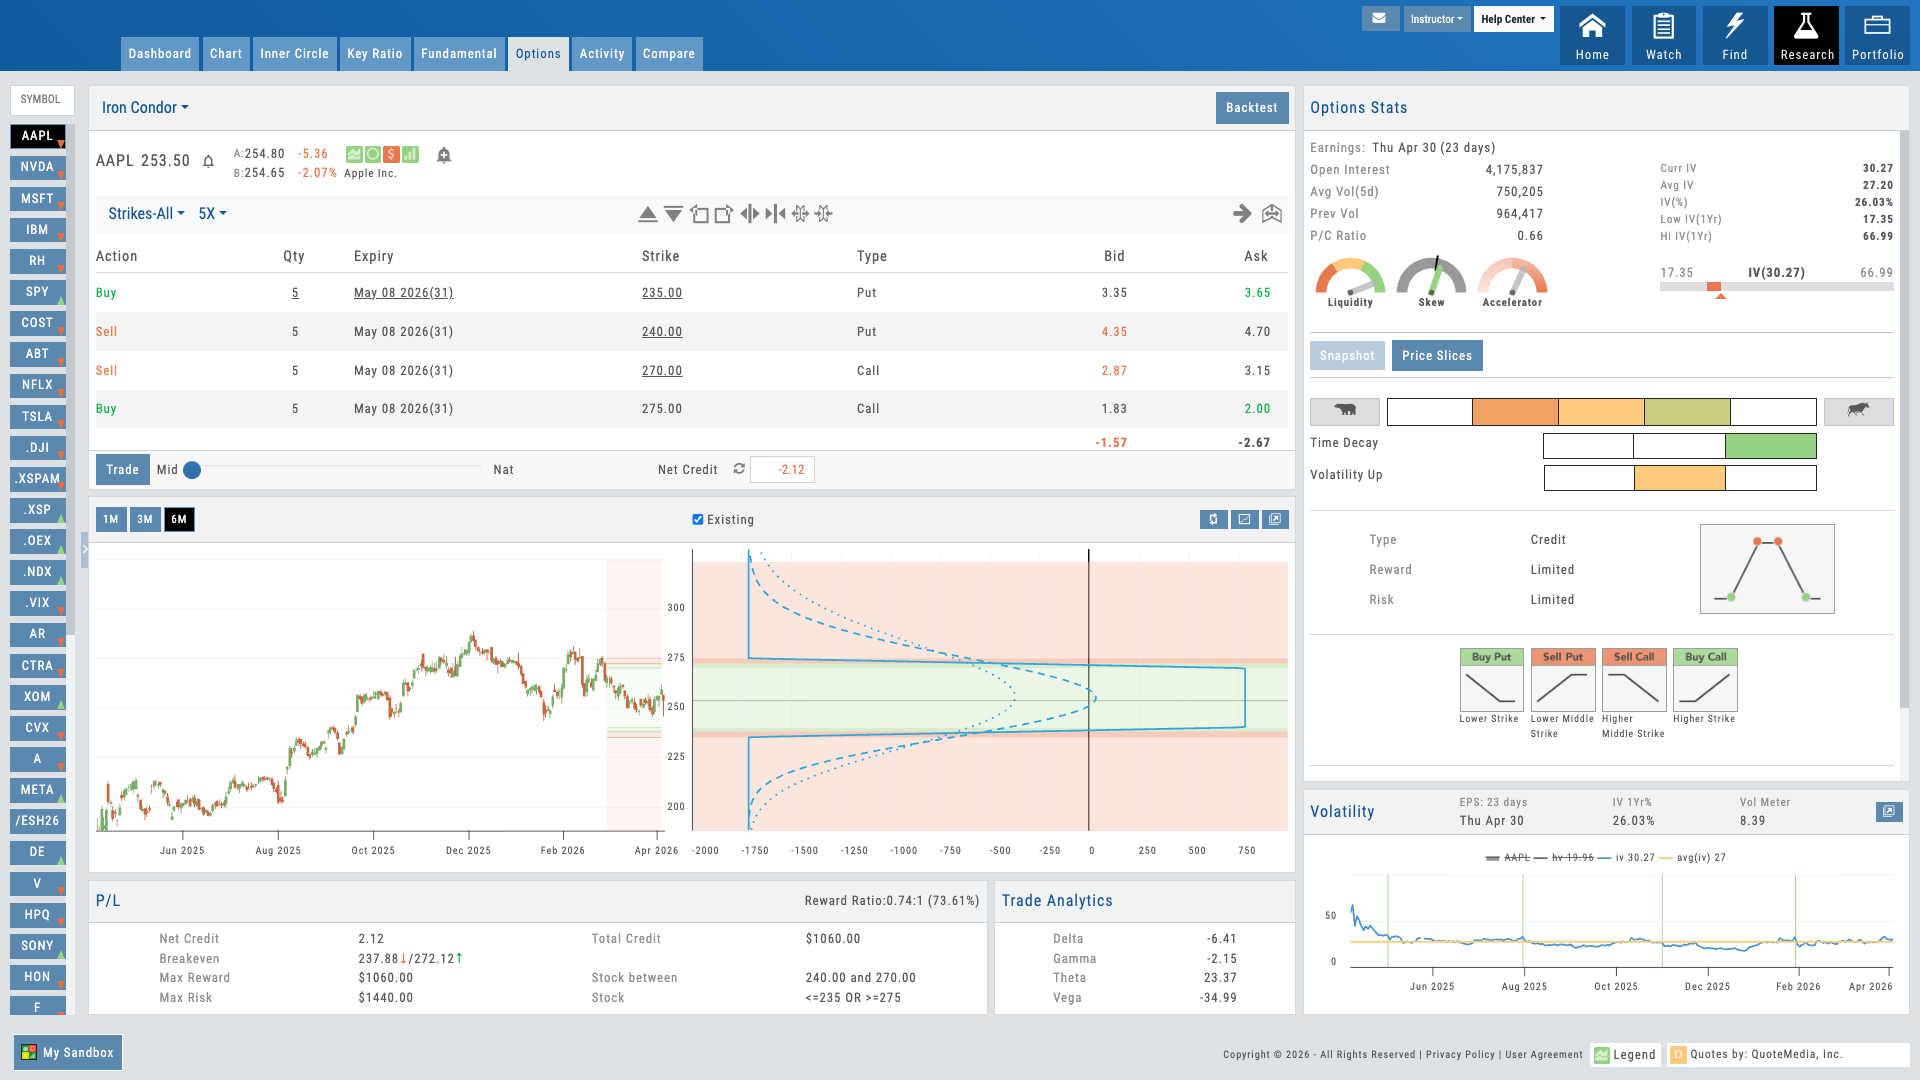
Hover over the pulsing dots to explore the trade builder
01 — Core Differentiator
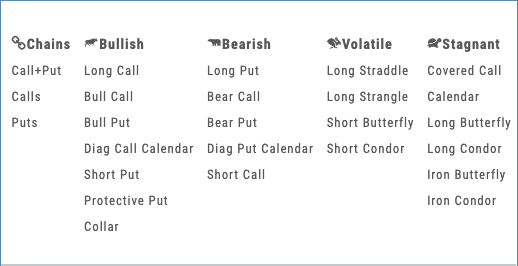
20 Strategy Templates That Make Options Easy
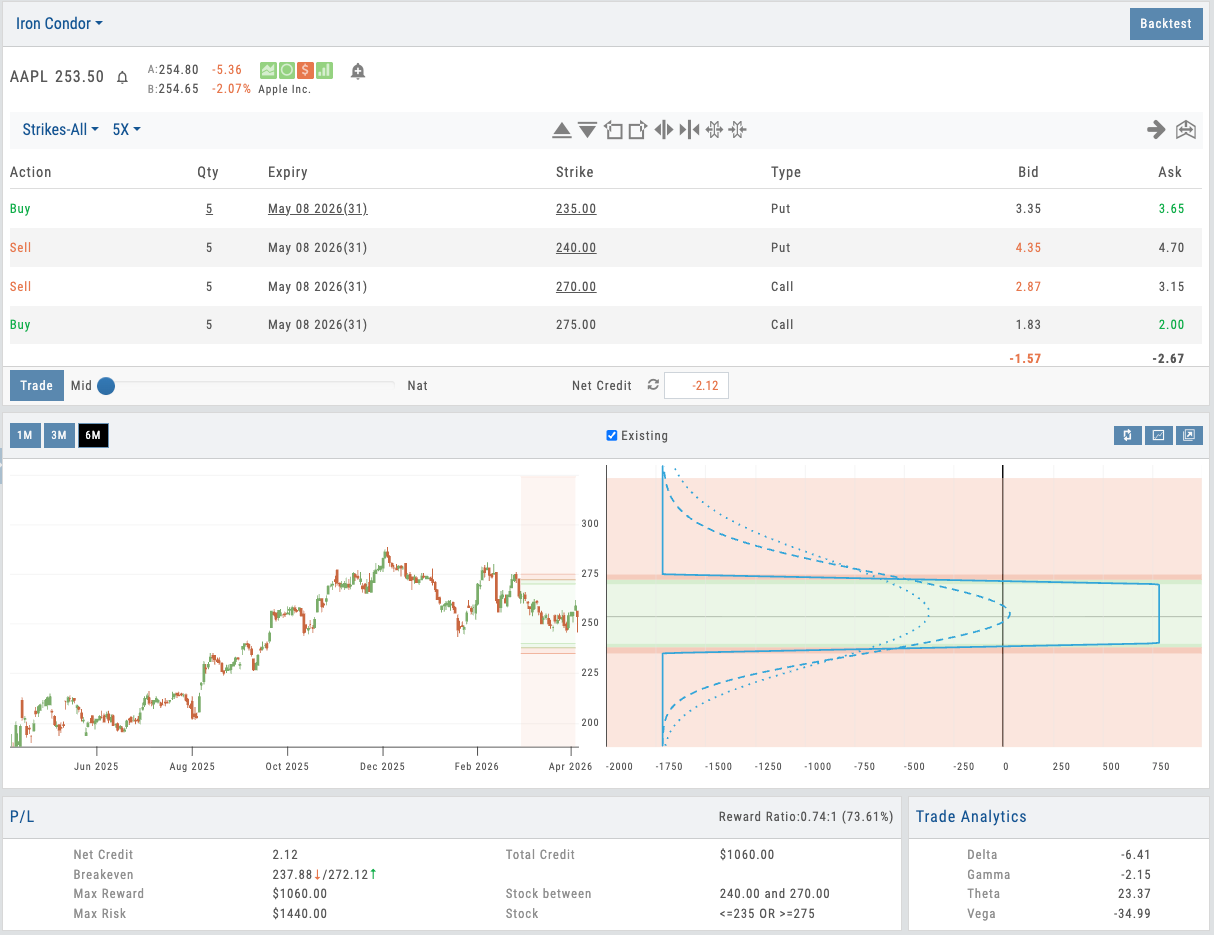
Skip the complexity of the full options chain. Pick a strategy, and everything you need is right there — max risk, max reward, breakeven, risk/reward ratio, net Greeks, and a visual P&L that shows exactly where you make and lose money.
Options chains are overwhelming. Hundreds of strikes, multiple expirations, and it takes real expertise to know which legs to combine. iVest+ strategy templates cut through that complexity. Pick a strategy — bull call spread, iron condor, collar, straddle — and the template builds the trade for you. You’re immediately in the strategy you selected, no guesswork required.
Everything a trader needs to evaluate the trade is right on the screen. Max risk, max reward, breakeven points, risk/reward ratio, and net Greeks — delta, gamma, theta, vega — all calculated instantly. The P&L chart shows profit and loss zones in color directly on the price chart, so users see at a glance where the trade makes money, where it loses, and where the breakevens fall. No mental math. No spreadsheet on the side.
Built-in guardrails make it impossible to misconfigure. Dates sync automatically, quantities lock relative to each other, and strikes are restricted to valid combinations. Students can’t accidentally build an invalid trade. Institutions get zero malformed orders reaching the broker.
For educators, this changes how options are taught. Students focus on strategy logic — why this spread at this width — instead of fighting order mechanics. For traders evaluating a position, every number they need is already calculated and visual. Pick the template, read the risk, place the trade.
- 20 strategy templates — pick a strategy and the trade builds itself, no chain required
- Max risk, max reward, breakeven, risk/reward ratio, and net Greeks all calculated instantly
- P&L zones shown in color on the chart — see profit and risk areas at a glance
- Built-in guardrails prevent invalid trades — zero malformed orders reach the broker
Click to enlarge
Bull call spread with P&L zones, breakeven, max risk/reward, and Greeks — all on one screen
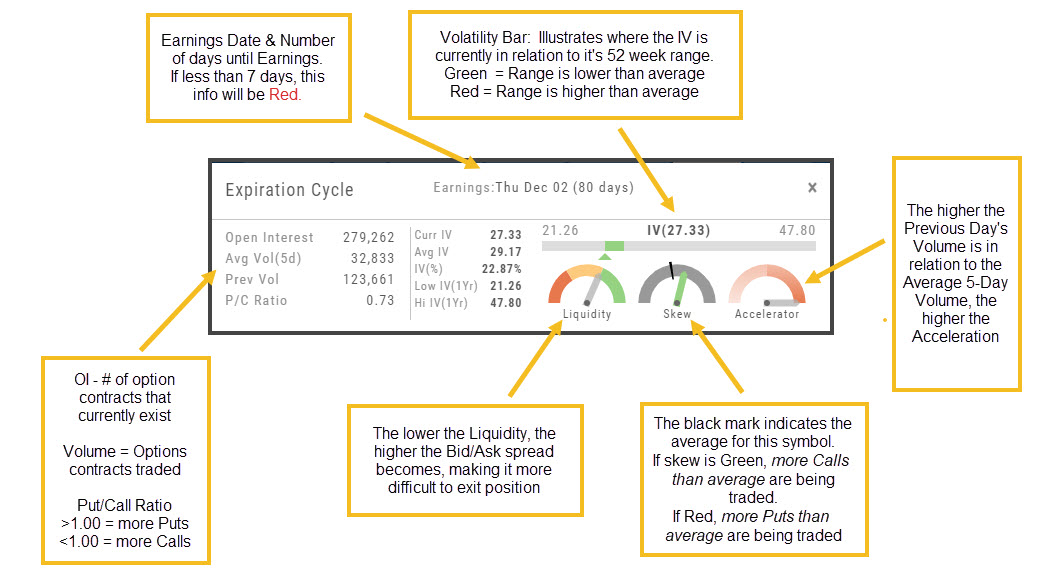
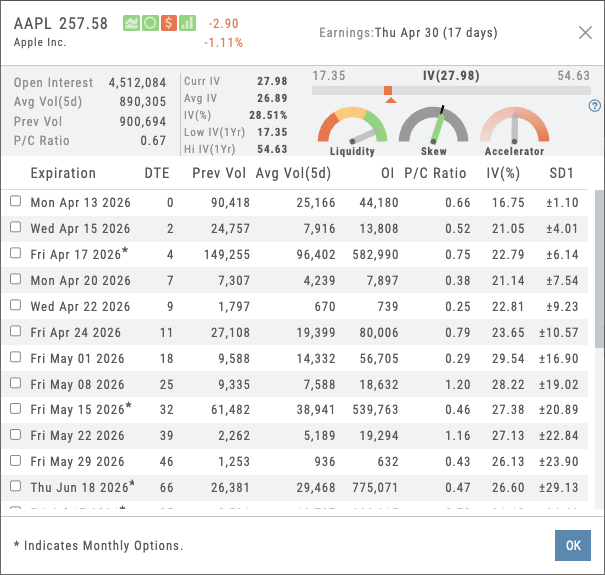
Three gauges displayed: Accelerator (green), Skew (yellow), Liquidity (multicolor 5-factor)
02 — Proprietary Intelligence
3 Proprietary Gauges
Momentum, volatility skew, and multi-leg liquidity — metrics built on 25+ years of options data and unavailable anywhere else.
The Accelerator gauge measures short-term momentum and momentum exhaustion — essential for timing option entries before volatility spikes. The Skew gauge reads the options market’s view of future volatility distribution — critical for spread traders to know if skew is stretched or depressed.
But the Liquidity gauge is the real secret. While competitors offer bid-ask spreads, iVest+ calculates a comprehensive 5-factor liquidity score that accounts for depth, width, tightness, fill probability, and execution cost across all legs. For multi-leg positions, no other platform gives you this visibility into actual tradability before you commit.
All three gauges are also available on the Research module’s detail pages — giving your traders institutional-grade analysis under one cohesive brand experience.
- Accelerator — momentum and exhaustion timing for entry decisions
- Skew — volatility distribution for spread strategy positioning
- Liquidity — 5-factor tradability score for multi-leg orders
- All three gauges are proprietary and unique to iVest+
03 — Scenario Analysis
See What Any Scenario Does to Your Trade
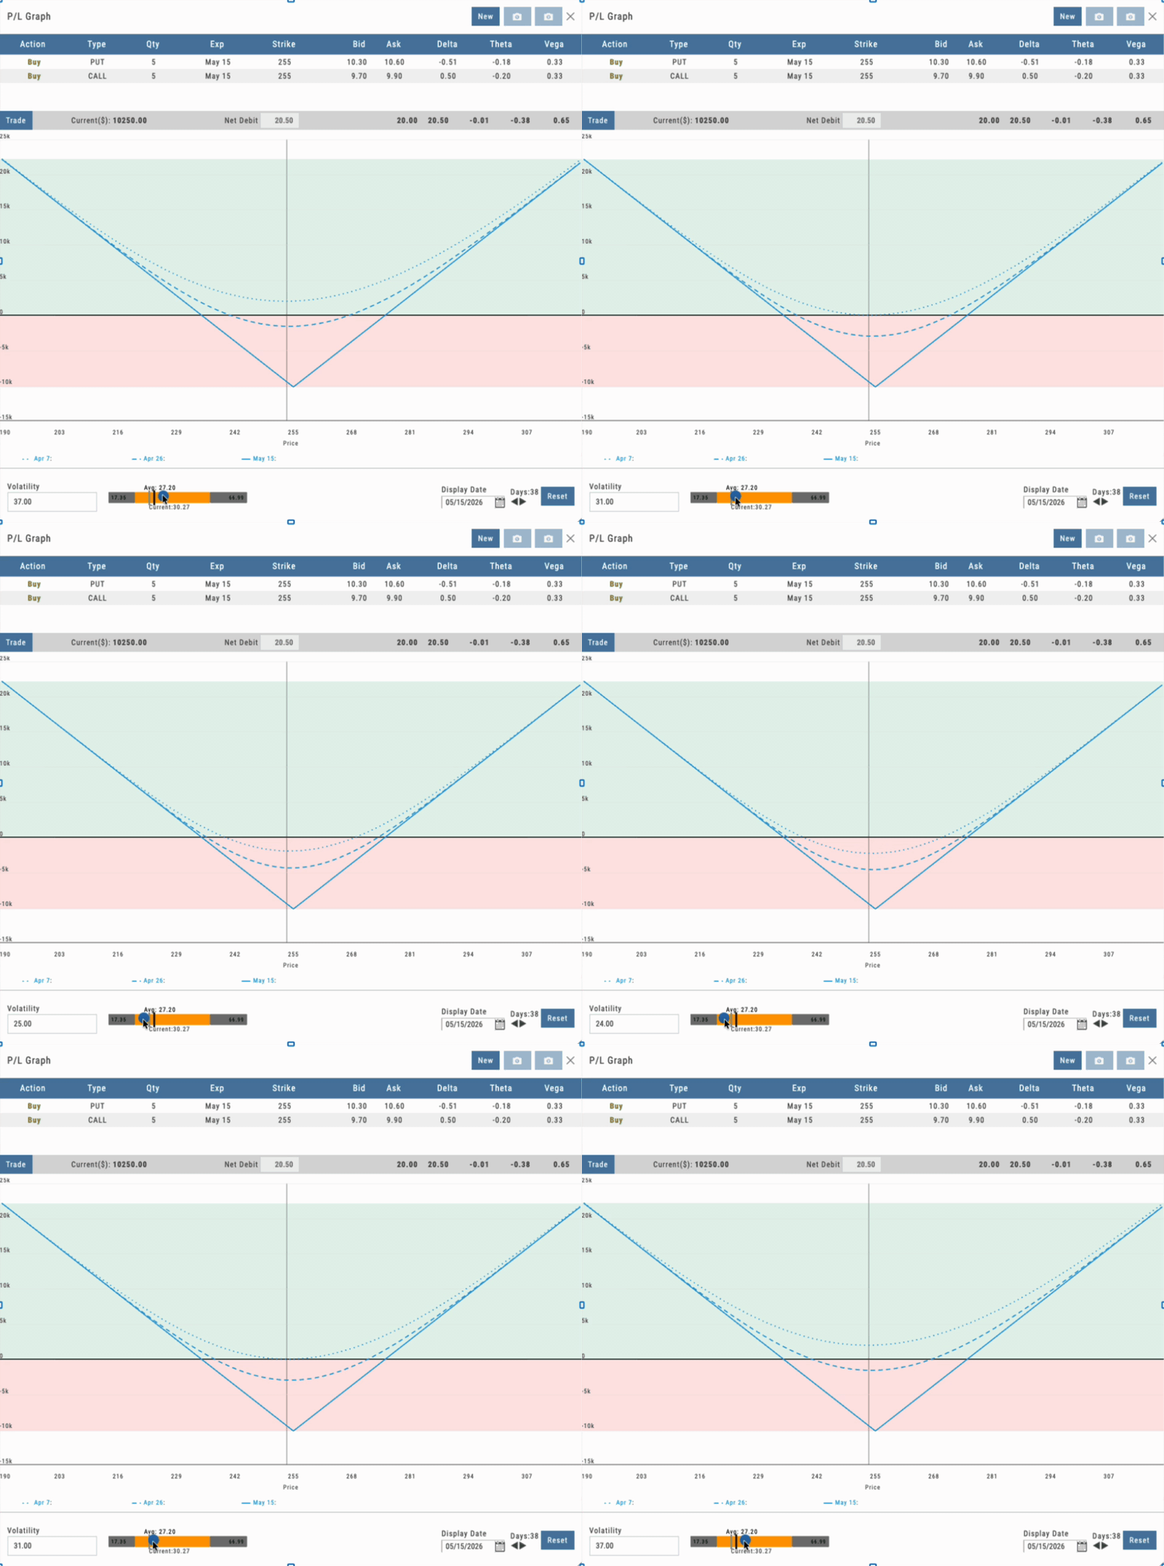
Model any scenario before you commit. Drag the IV slider to see volatility impact, or use Price Slices to see exactly what your trade is worth at any price on any date.
Option traders live and die by implied volatility. A straddle bought at 52% IV that drops to 41% post-earnings can turn a $300 loss into a $1,200 loss — but most platforms force you to imagine that outcome. iVest+ shows it. Drag the IV slider up or down from the current level, and a dotted line appears on the risk graph showing the projected position value at the adjusted IV. You see exactly what happens to your P&L if volatility rises, collapses, or stays flat.
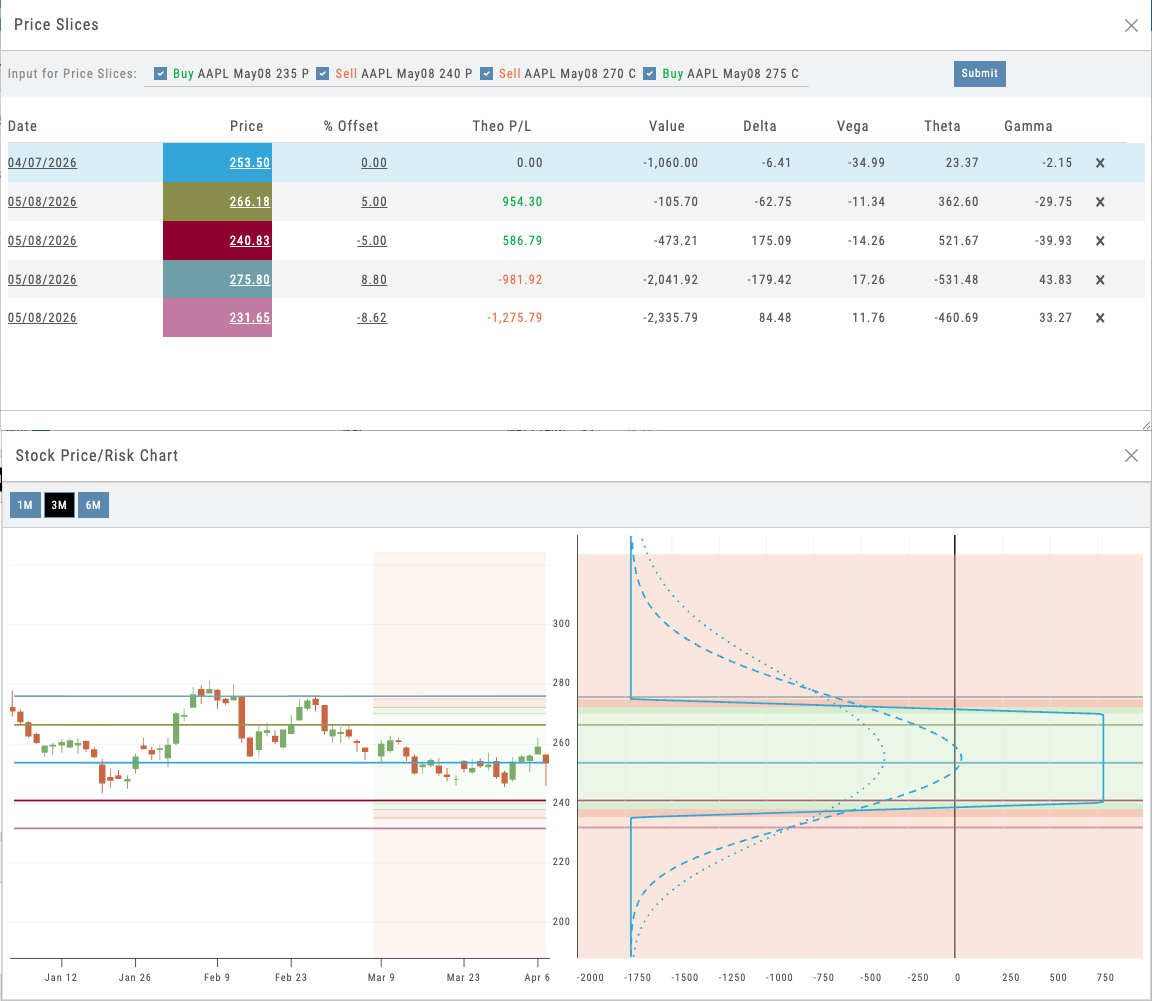
Price Slices take it further. Set any price point — by entering a value, a percentage offset, or simply dragging a line on the chart — and see the theoretical P&L, position value, and Greeks at that exact price. Set the date you want to analyze, and the calculation adjusts for time decay. Add multiple lines for deeper analysis: what does the trade look like at the current price, at your target, and at your stop? All three answers are on the screen at once.
For educators, students stop guessing about vega and theta — they see them. Move the IV slider to understand why selling premium into high IV works. Drag a Price Slice to next Friday and watch theta eat into the position. For traders, it’s the fastest way to answer “what’s this trade worth if the stock hits X by Y date?” — no spreadsheet required.
- IV Slider projects position value at any volatility level on the risk graph
- Price Slices show theoretical P&L, value, and Greeks at any price and date
- Enter a price, percentage offset, or drag lines directly on the chart
- Add multiple price lines for side-by-side scenario comparison
Click to enlarge
Click to enlarge
Price Slices with draggable lines showing theoretical P&L at multiple price targets alongside the IV slider
Want to Offer Institutional-Grade Options Analytics Under Your Brand?
20 strategy templates, proprietary gauges, dynamic risk analysis, and 25+ years of backtesting — deployed as part of your branded platform.
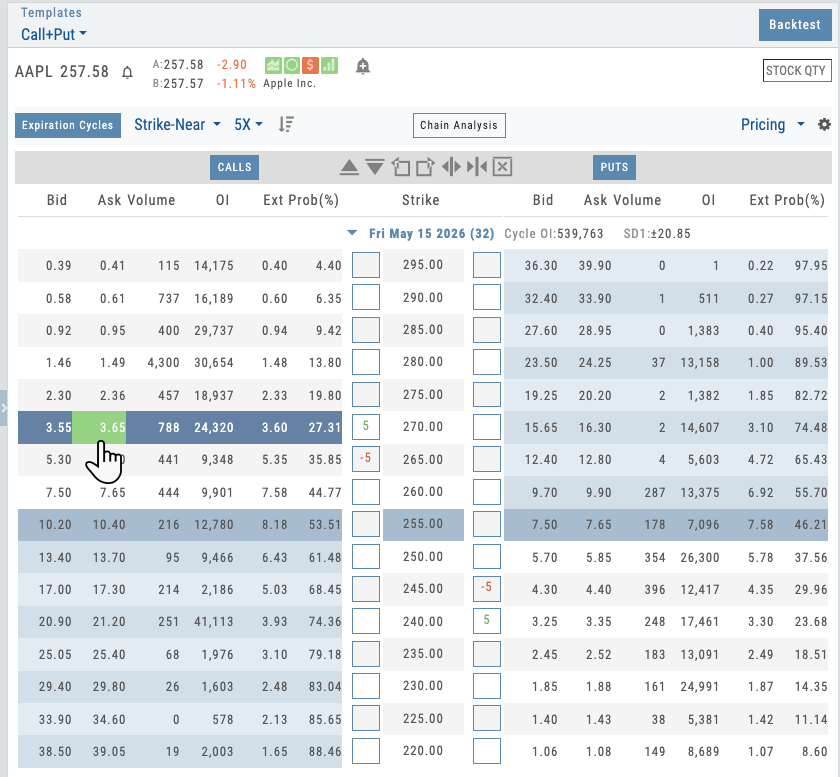
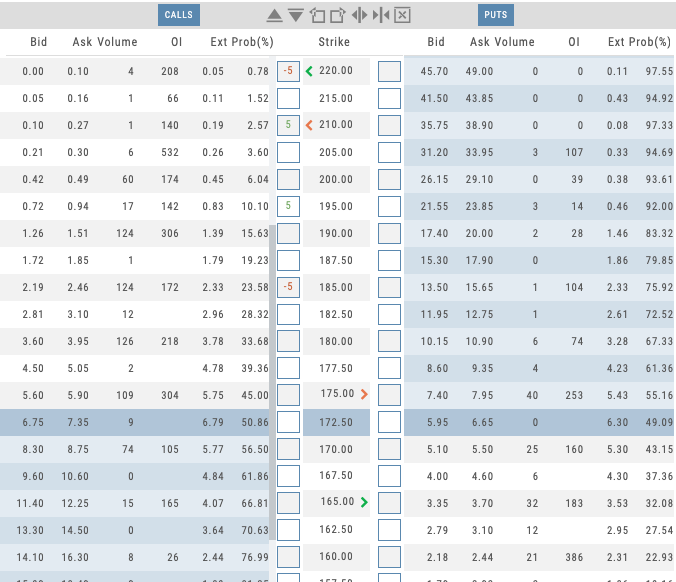
Options chain with strategy template selector and one-click leg placement
04 — Direct Execution
Trade Directly from the Chain
Select a strategy template from the chain. Watch it auto-populate with one-click leg placement. Then refine and send.
The options chain is how traders think. They scroll through strikes, they see the data, they build. iVest+ bridges the gap between chain analysis and strategy building.
Select a Butterfly Spread from the template menu on the chain. The template is applied to the selected call. One click on the 50 Delta call, one click on the 40 Delta call, one click on the 30 Delta call, and your Butterfly is built with the right structure, right spacing, and right quantities. No manual configuration. No back-and-forth. The trade matches exactly what the template says it should be.
Refine quantities, adjust prices, change dates if needed — the guardrails keep everything valid. When you’re ready, use the price negotiation slider to adjust your limit price within the bid-ask spread — typically 25–30% off the spread toward the midpoint gives you better fills without chasing. Then send to the broker, or stage it for later.
Not ready to execute? Stage the trade. Staged orders save your position for later without submitting to the broker. Stage from scans, templates, or the chain. Come back later, review, modify, and execute when the setup confirms. Staged trades persist across sessions — nothing gets lost. And for students learning the process, our built-in virtual account lets them practice the entire workflow with realistic fills, including exercise, assignment, and cash-settled index options — the most realistic paper trading available.
- Select strategy template directly from the chain — one-click leg placement
- Price negotiation slider for better fills within the bid-ask spread
- Stage trades for later — review and execute when the setup confirms
- Built-in virtual account with realistic fills, exercise, and assignment
05 — Deep History
25+ Years of Daily Options Backtesting
Step through any day since 1999 and watch Greeks evolve in real time. See how your strategy would have performed under any market condition in 25+ years.
Options backtesting as easy as 1, 2, 3.
- Select the Start Date
- Setup Your Trade
- Select the Analyze Date
See the Results
Backtesting options is harder than backtesting stocks. Greeks change every day. Volatility shifts. Decay happens. Most platforms offer point-in-time results. iVest+ gives you day-by-day stepping.
Select a strategy. Set an entry date. Then step forward one day at a time and watch how the position evolves. See the Greeks on day 1, day 2, day 15. Watch gamma compress, vega shift, theta decay. Plug in historical prices and watch the P&L surface update. This isn’t looking at a line chart — it’s actually living through the trade, day by day.
For educators, this is revolutionary. Students understand options by experiencing them in minutes vs weeks or months. For traders testing strategies, this is the difference between a theoretical backtest and actually knowing what would happen. And because you can test any date since 1999, you can test strategies across the 2008 crisis, 2020 pandemic, 2022 rate shock, and dozens of other market regimes in living color.
- Daily stepping from 1999 to present for any strategy
- Watch Greeks and P&L change in real time as you advance
- Test across different market regimes (2008, 2020, 2022, etc.)
- Full decay, volatility, and price history embedded
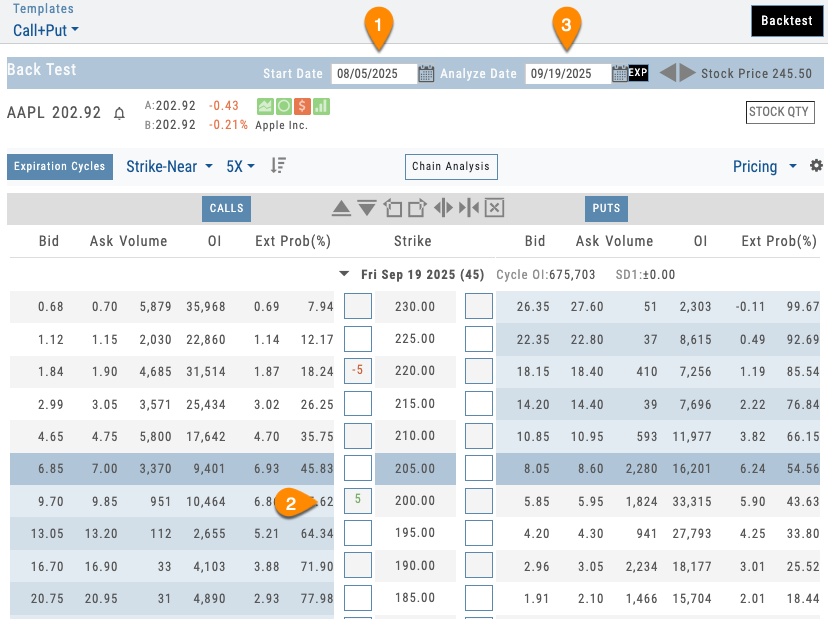
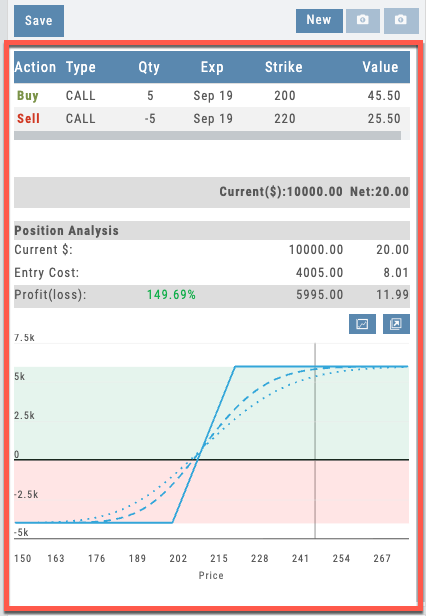
Daily stepping interface showing historical date picker and day-by-day Greeks evolution
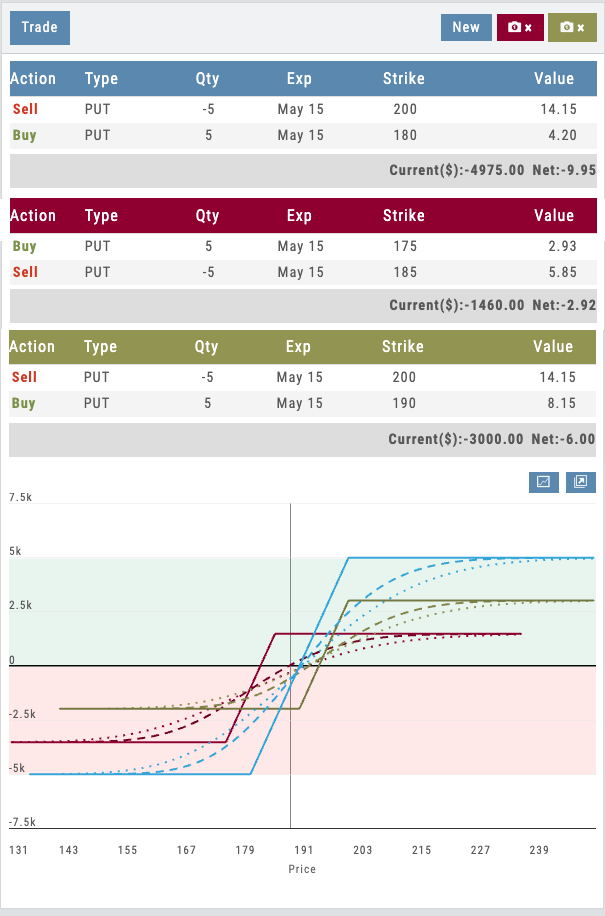
Three candidate trades with color-coded tables and overlaid P&L curves on a single risk graph
Side-by-Side Decision
Three Trades. One Decision.
Compare up to three trade variations on a single risk graph. See the cost, strikes, and P&L curves of every candidate at once — then pick the one that fits your outcome.
Most platforms force you to build a trade, study it, tear it down, build the next one, and try to remember what the first one looked like. iVest+ keeps all three live. The tables stack, the risk curves overlay in matching colors, and the current P&L updates for each.
Wider spread for more credit, or tighter for higher probability? You’re not guessing — you’re comparing. When you see the one you want, click it and hit Trade. It’s the simplest way to compare and take action in a single screen.
- Three positions live on one chart
- Color-coded tables tied to color-coded P&L curves
- Adjust strikes, widen/narrow spreads, change quantity — curves update instantly
- Click your choice and Trade — no rebuilding, no re-entering
Take It With You
Pop It Out. Decide With the Full Chart Open.
Detach the P&L panel and navigate anywhere in the platform — charts, indicators, fundamentals, heatmap — while your position stays visible.
Most platforms force you to choose: analyze the trade or study the chart. iVest+ gives you both at once. Pop out the P&L graph and move it to any monitor or tab — see your position alongside the daily chart, moving averages, volume, RSI, and support/resistance levels, all live at the same time.
When you use the rolling icons to shift a strike or roll an expiration, you watch the risk curve update while staring at the exact price level you’re rolling to. Decision-making with the trade and the technicals in the same field of view.
- Detach P&L panel and keep it on screen while navigating the app
- Analyze the options position next to full technical charts
- Roll strikes or expirations with the rolling icons — watch P&L update live
- No alt-tab, no memorizing levels, no rebuilding
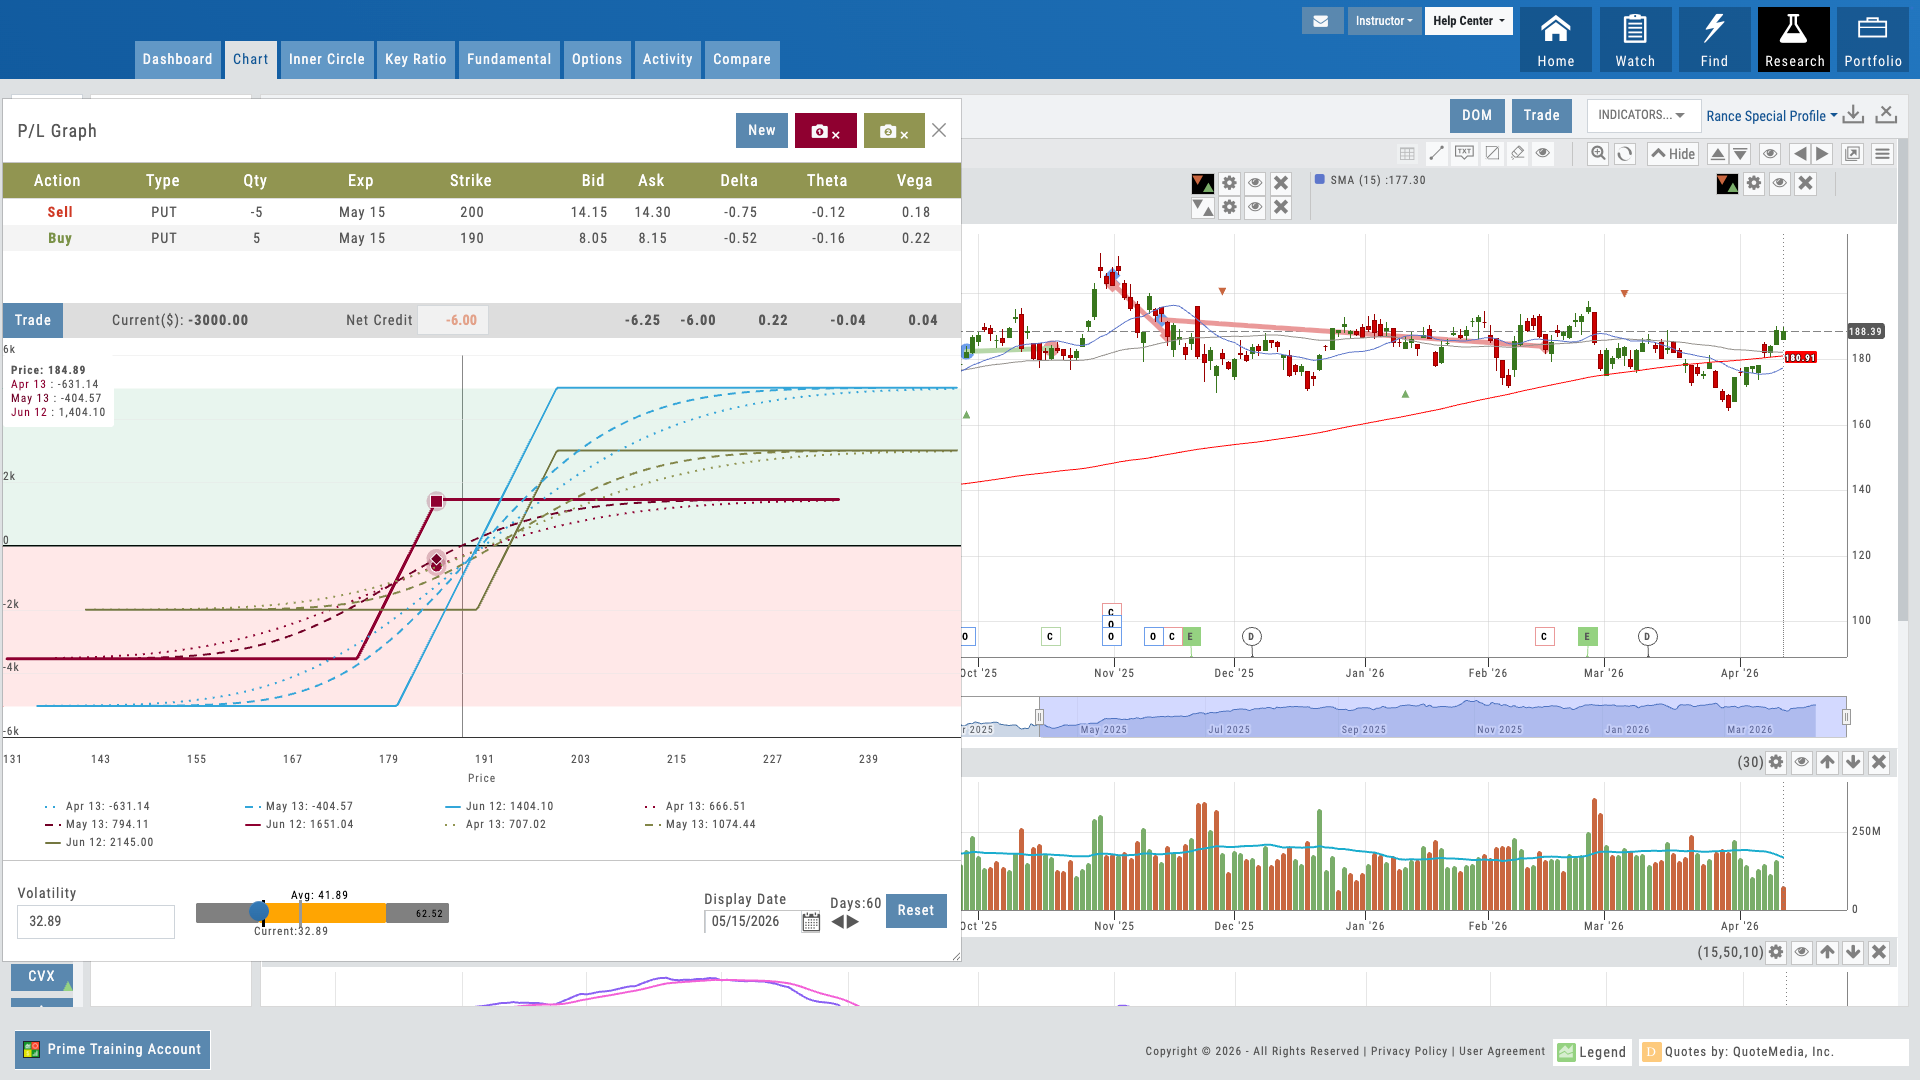
P&L panel floating alongside a full chart with moving averages, volume, and indicators
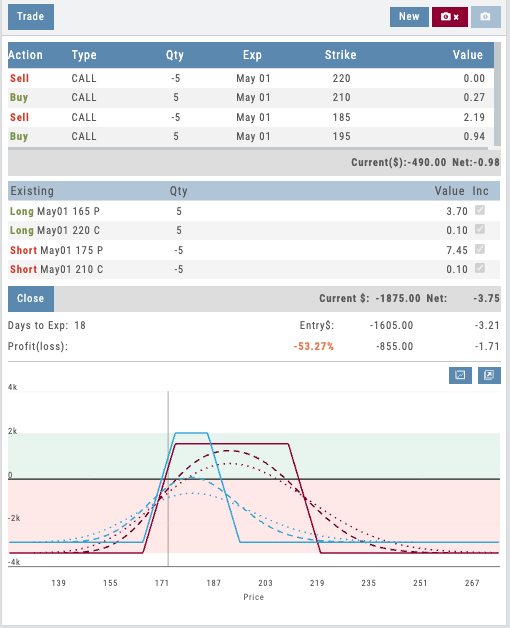
Current position vs. adjusted position displayed side by side on the risk graph
06 — Trade Management
Manage and Adjust Live Trades
See your current positions on the risk graph, build any adjustment, and instantly compare the current trade against the adjusted version — all before you commit.
Options trading doesn’t end when the trade is placed — managing positions is where the real skill lives. iVest+ shows your current position directly on the risk graph so you can see exactly where you stand: your breakevens, max risk, max reward, and how the position performs across price and time.
From there, create any adjustment — roll a short call out and up, add a protective put, convert a vertical into a butterfly — and instantly see a side-by-side comparison of your current trade versus the adjusted version. Both risk profiles display together so you can evaluate the trade-off before committing a single dollar.
For educators, this is where theory becomes practice. Students see how rolling a covered call changes the risk profile in real time. For traders, it eliminates guesswork — you know exactly what the adjustment does to your Greeks, your breakevens, and your max risk before you execute.
- Current positions displayed on the risk graph with breakevens and max risk
- Create any adjustment and compare current vs. adjusted side by side
- See how rolls, additions, and leg changes affect Greeks and breakevens
- Evaluate the full trade-off before executing — no guesswork
Deepest Options Analytics, Under Your Name
20 strategy templates with guardrails, three proprietary gauges, dynamic P&L with IV slider, trade from chain, 25+ years of backtesting, and multi-position comparison — all deployed as part of your branded platform. Your users get institutional-grade options analytics. You get a value layer that drives retention and positions you as the serious option for serious traders.
A Video Built for Your Business
Not ready for a call? Tell us about your business and we’ll record a video of the platform built around it — your audience, your asset classes, the tools your members would actually use. No generic demo.
Ask a question
Ask anything about the platform, the partner model, or how a deployment works. A real person answers — no bot, no drip sequence.
Connects to leading brokerages including Schwab, Tradier, and more. See all supported brokers →