

Journal Module
Every Trade Analyzed Automatically
Automatic leg-level trade matching. 80+ strategy identification. 25+ performance reports. Life-of-trade tracking. AI-powered analysis. All without manual journaling — and all under your brand. Every trade becomes a coaching opportunity.
The Journal
Interactive Guide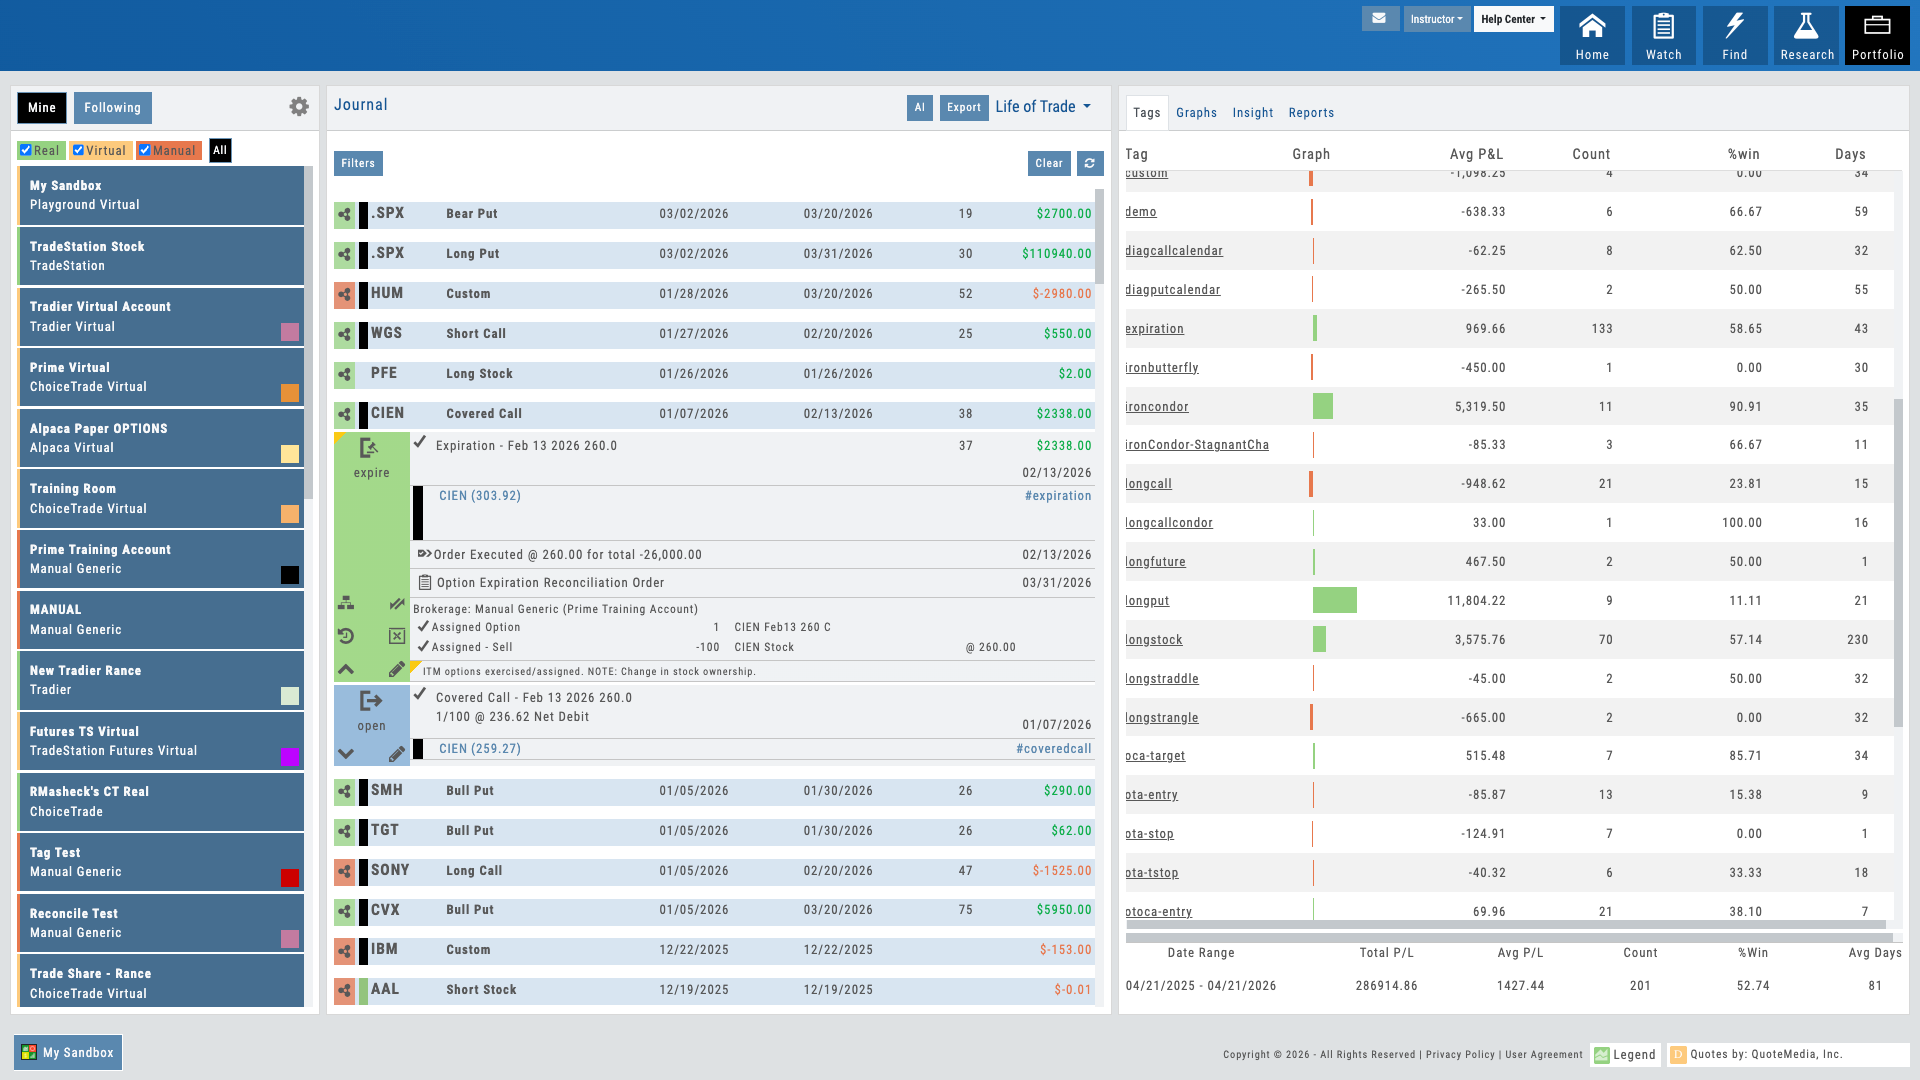
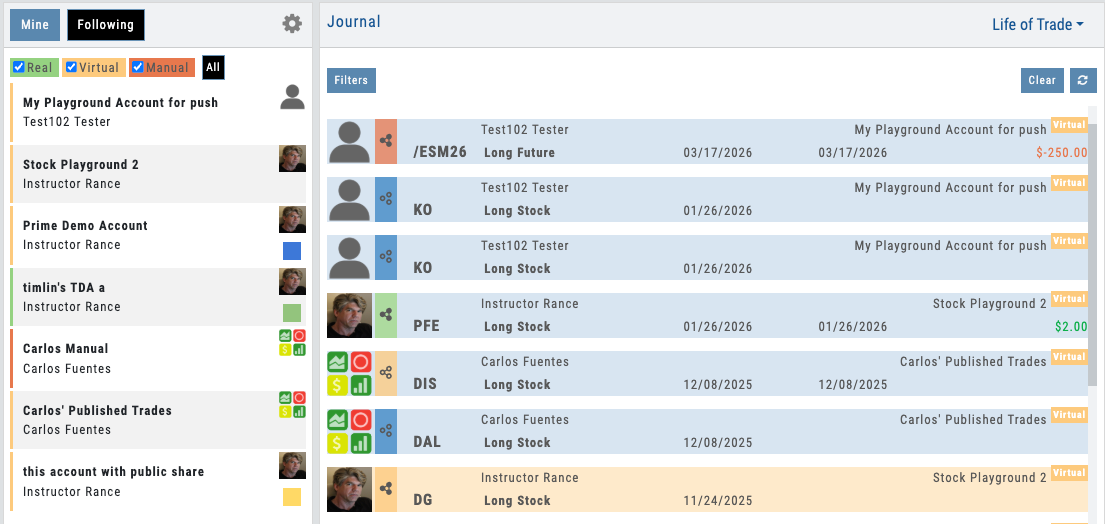
Trade journal with auto-tagged strategies and life-of-trade timeline
01 — Core Differentiator
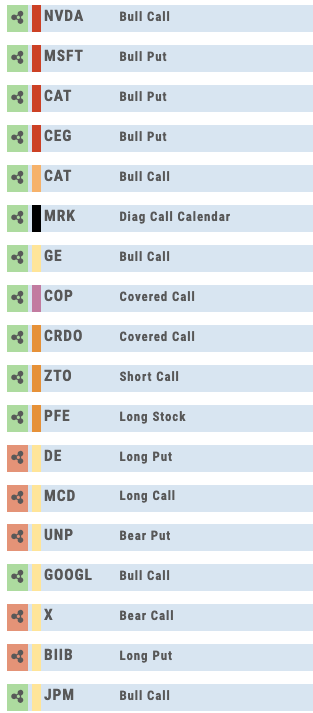
Automatic Strategy Identification
The platform matches option legs automatically. 80+ strategies recognized — no manual tagging required.
Most traders log their trades manually: enter the underlying, record the entry price, note the strategy type. Most platforms do nothing with this data except store it. iVest+ is different.
The moment a multi-leg trade is imported, the platform analyzes the strike prices, expiration dates, and leg types, then matches them against 80+ known option strategies — iron condors, vertical spreads, butterflies, diagonals, straddles, collars, and dozens more. Each trade is instantly tagged with a strategy ID. No student confusion. No manual miscategorization. The journal knows what was actually traded.
For educators, this is transformative. You no longer have to correct students’ trade logs or spend time managing tags. The platform enforces accuracy at the point of entry. Your students focus on learning; the system handles classification.
- 80+ option strategies automatically recognized (iron condor, vertical spread, butterfly, diagonal, straddle, collar, etc.)
- Multi-leg trades tagged instantly at import — no manual entry required
- Strategy ID assigned and searchable across all student accounts
- Eliminates miscategorization and manual review of trade logs
Multi-leg trade auto-tagged with strategy ID and leg breakdown
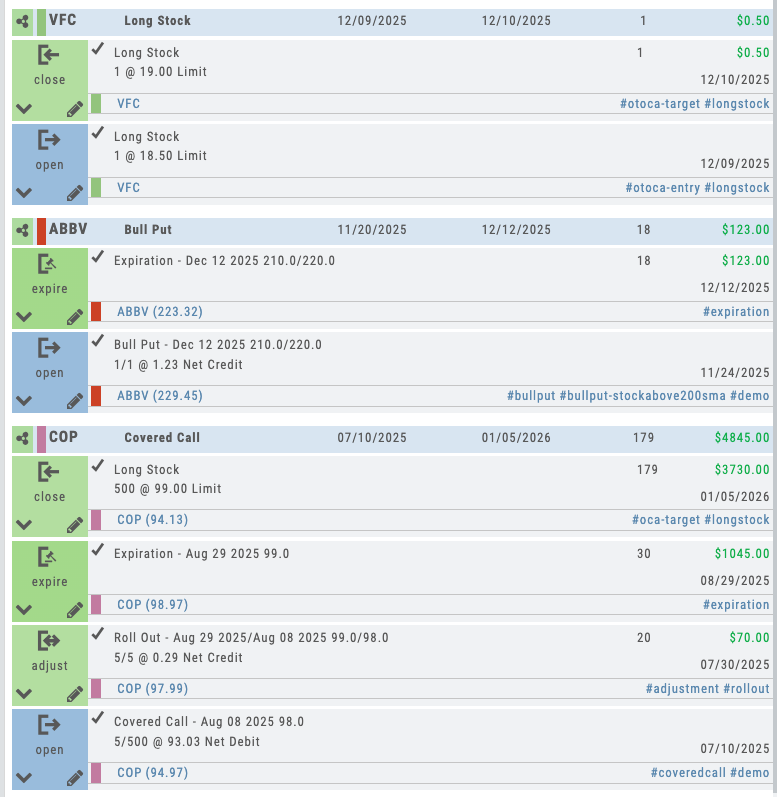
Trade timeline showing open, adjustments, rolls, and close with P&L at each step
02 — Coaching Catalyst
Life-of-Trade Tracking
Follow every trade from open through every adjustment to final close. Complete history. Complete context.
A trade is never just one transaction. It’s opened, adjusted, rolled, closed. Most journaling tools capture the final close P&L and call it done. iVest+ captures the full story: entry date, first adjustment date, second adjustment, roll details, closure date, and P&L at every stage.
This timeline view shows traders (and their coaches) exactly how the trade evolved. They can see why an adjustment was made, when the decision to close came, what the cumulative P&L was at each decision point. It’s the difference between seeing a final score and watching the entire game.
For educators, this feature is the retention secret. Students stay engaged far beyond the course when they can review their actual decision-making journey. Every mistake becomes a learning moment. Every successful adjustment becomes evidence of growth.
- Complete trade timeline from entry to close
- Every adjustment recorded with date, price, and reason
- Rolls and defensive closes tracked separately
- P&L snapshot at every decision point
- Enables pattern analysis: which adjustments worked? Which didn’t?
03 — Auto-Tags
Every Trade Tagged, Automatically
Found it in a scan? Tagged. Set a bracket? Tagged. Rolled a covered call? Tagged. Hit your target or stopped out? Tagged.
The journal doesn’t just record trades — it categorizes them so you can see exactly what’s working and what isn’t. Beyond the 80+ strategy identifications, the system tags every contextual detail: which scan or condition triggered the trade, whether a full bracket was set, if the user rode through expiration, rolled out a position, or made an adjustment. It even analyzes whether the target or the stop was hit more often.
Add your own custom tags on top. Tag by thesis, market regime, setup type — anything. Then slice your performance reports by any combination. The auto-tagging turns raw trade data into structured, measurable intelligence.
For educators and coaches, this is where the journal becomes a teaching tool. Instead of asking “what happened?” you can see exactly how a student found the trade, how they managed it, and whether their process is producing results. The tags make every coaching conversation specific, data-driven, and actionable.
- Scan and condition source tagging — know how every trade was found
- Bracket, adjustment, and roll tracking — every management action tagged
- Target vs. stop analysis — see which exit hit more often
- Expiration behavior tracking — held, closed early, or rolled
- Custom tags — slice performance by any category you define
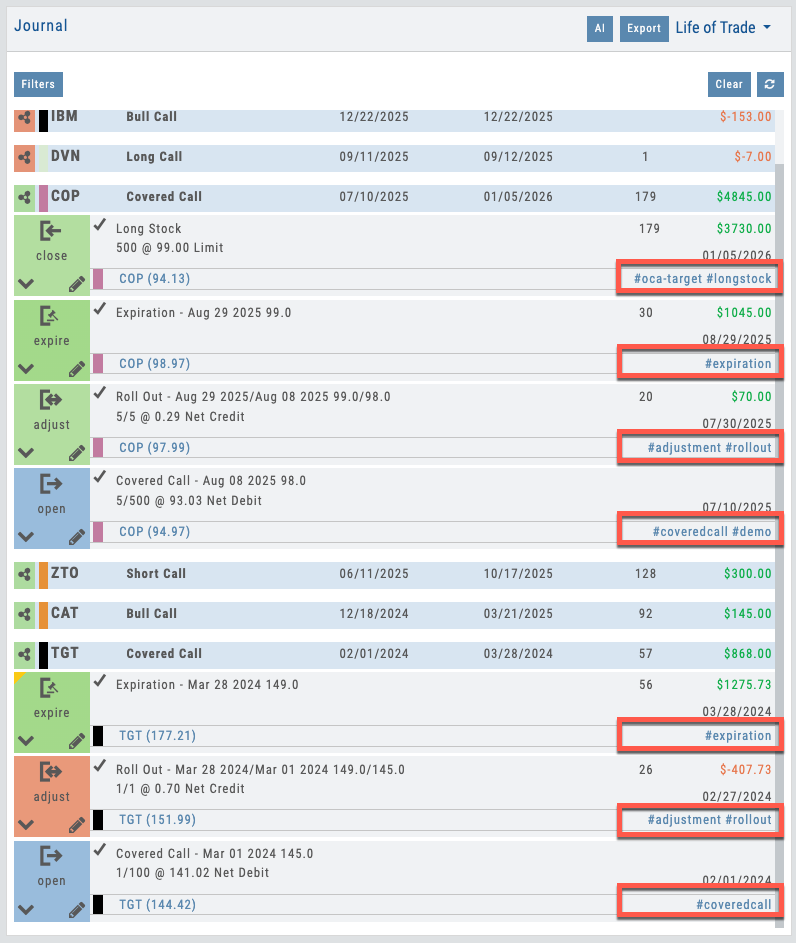
Trades automatically tagged by source, strategy, bracket behavior, and outcome
04 — Stock Research Context
Your Trade History Follows the Ticker
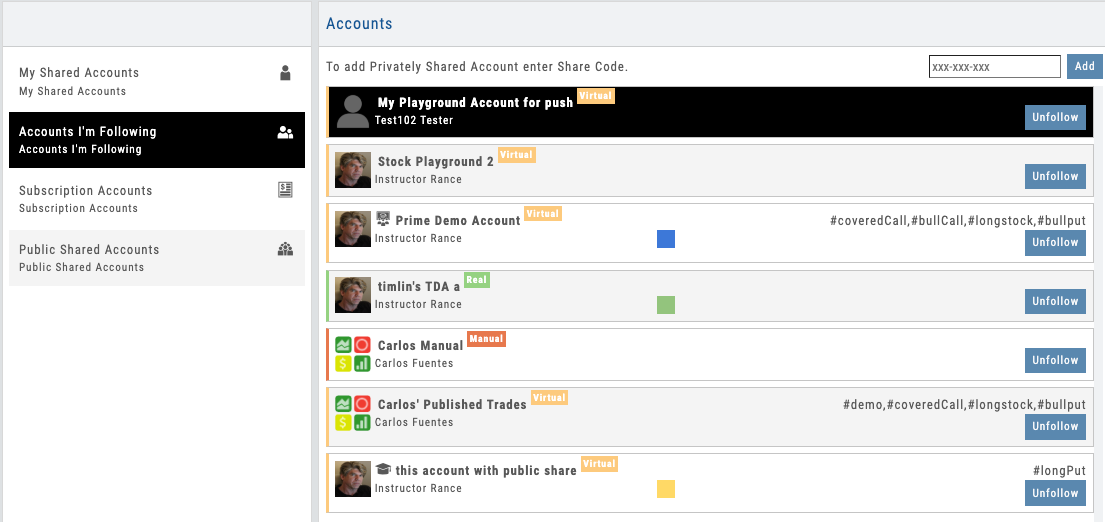
Pull up any stock in Research and your entire journal for that ticker is one tab away — trades, tags, and performance already filtered for you.
Every time your traders open a chart in Stock Research, the Activity tab is right there showing every trade they’ve ever placed on that symbol — executions, adjustments, closes, roll history, and the auto-generated strategy tags. No switching tools. No cross-referencing spreadsheets. No trying to remember what worked last time on AAPL earnings.
The tag-reporting panel on the right automatically filters to the ticker in view, so a quick glance tells the full story: P&L on this symbol, win rate, which strategies performed here, average hold time, and how current positions are behaving. It’s the journal, scoped to the exact decision the trader is about to make.
For B2B partners, this is where the coaching loop closes. Advisors reviewing a client’s position see the full history on that name in one screen. Educators demoing a trade idea pull up their own prior results as proof. Compliance teams audit by ticker without stitching reports together. The journal stops being a separate tool — it becomes context that follows every research session.
- Activity tab — every prior trade on the ticker, in chronological order
- Strategy tags and life-of-trade data shown inline for each entry
- Tag-reporting panel auto-filters to the symbol in view
- P&L, win rate, and hold-time stats scoped to this ticker only
- Open positions with real-time Greeks and adjustment history
- One-click jump back to full trade detail in the journal
- Cross-account view — see activity across every linked account at once
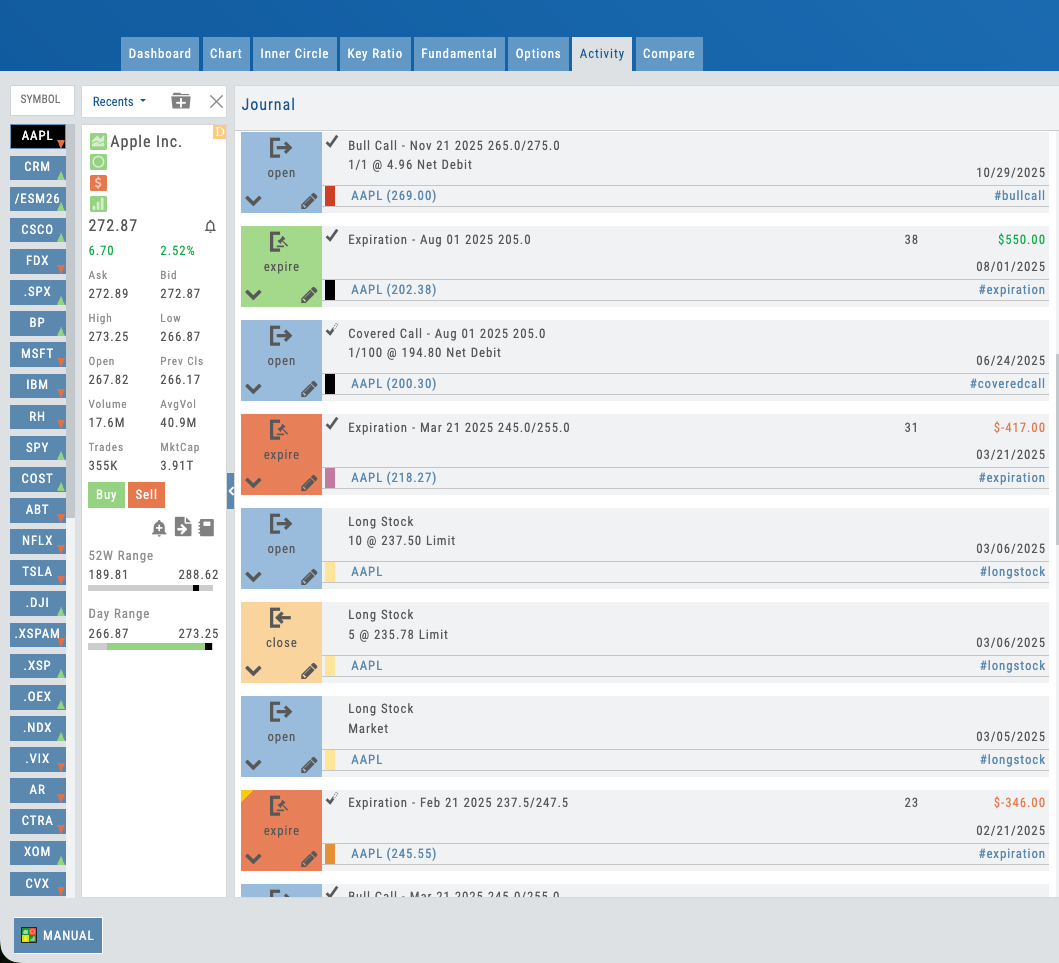
Stock Research Activity tab — every trade and tag for the ticker in view
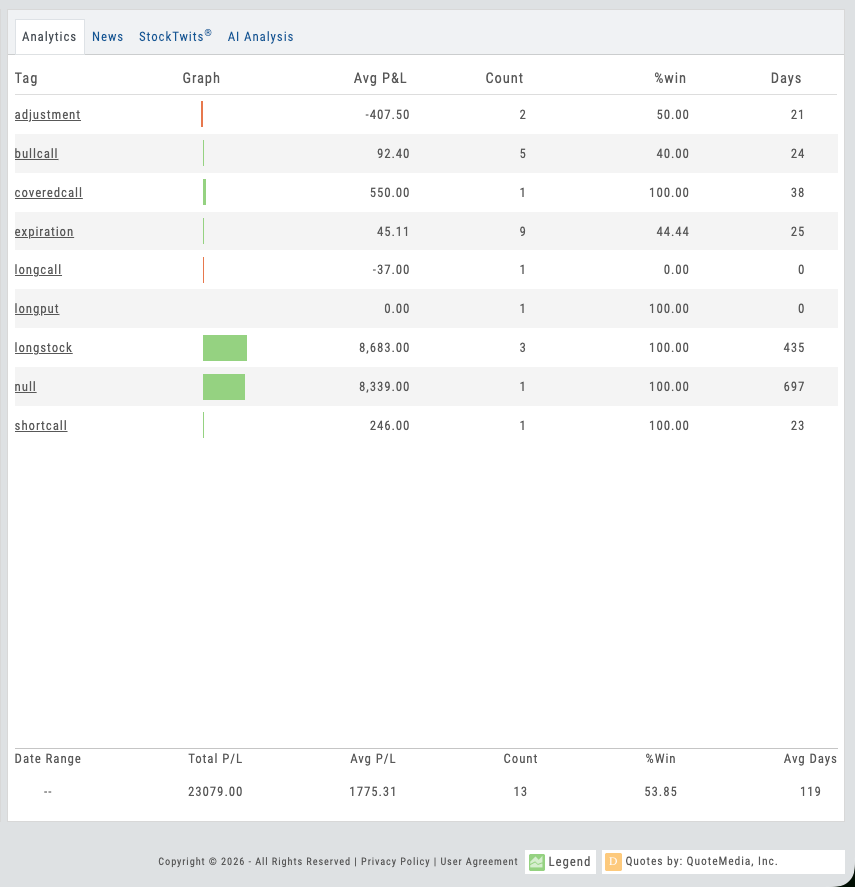
Tag-reporting panel auto-filtered to this symbol — P&L, win rate, and strategy breakdown at a glance
05 — Performance Intelligence
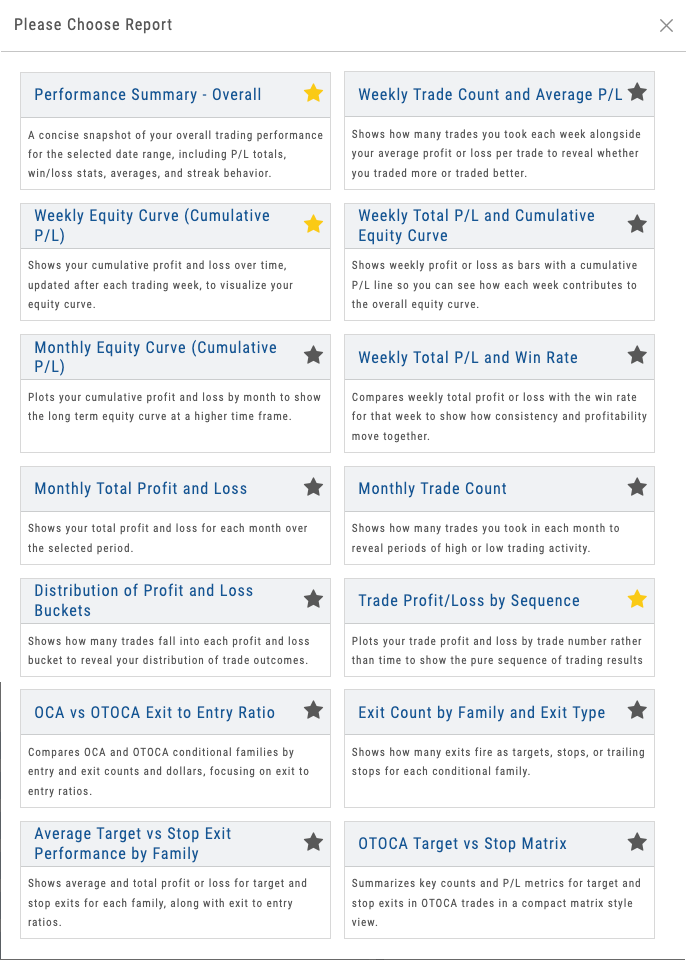
25+ Performance Reports
Tag analytics. Visual breakdowns. Pattern discovery. All based on actual trading data.
Strategy ID tags are the foundation for real analytics. The platform generates 25+ performance reports, all built on the automatic strategy classification: P&L by strategy type, win rate by tag, average holding period per strategy, profitability by underlying, performance by time-of-day, adjustment success rates, and custom breakdowns by hashtags.
Your students (and your coaches) don’t have to wonder what they’re good at and what needs work. The data tells the story. Iron condors beating spreads? The reports show it. Earnings trades underperforming? Visible in seconds. Adjustments actually improving position P&L? Quantified.
For B2B partners, these reports transform the journal from a record-keeping tool into a performance management system. Coaches see student strengths and blind spots without digging through trade history. Educators track cohort performance by strategy type across hundreds of students.
- P&L by strategy type — see which strategies are profitable
- Win rate by tag — percentage of winning trades per strategy
- Average holding period per strategy
- Profitability by underlying symbol
- Performance by time-of-day and market conditions
- Adjustment success rates — which defensive moves worked?
- Custom hashtag analytics — track performance on topics you define
Dashboard showing P&L by strategy, win rate, and performance breakdowns
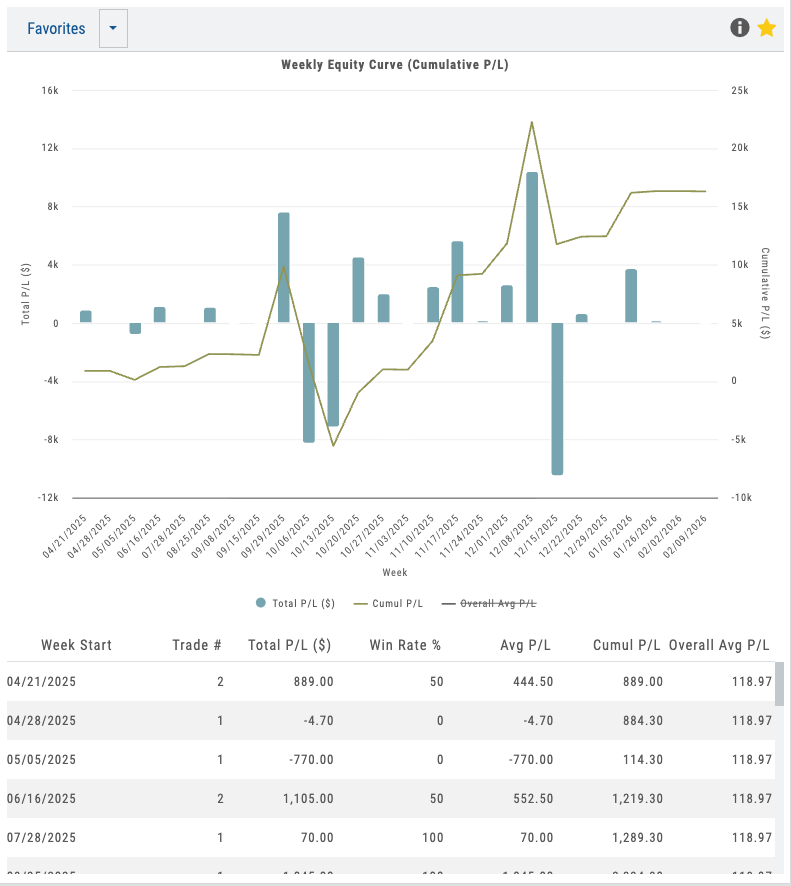
Weekly equity curve with cumulative P&L and win-rate by week
Want Your Students' Trades Analyzed Automatically?
Automatic journaling and strategy identification under your brand. Your students keep their trades logged, your coaches get actionable insights, and you eliminate manual review overhead.
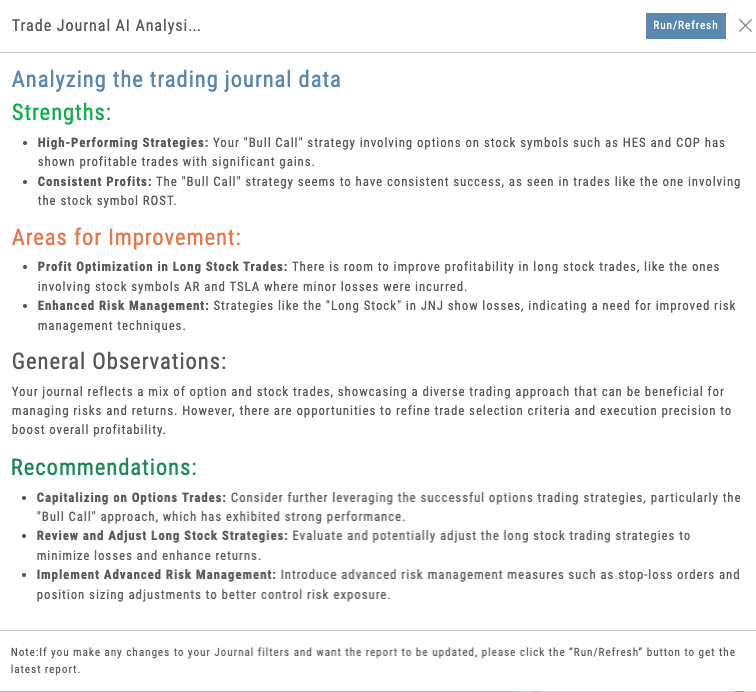
AI analysis showing strengths, blind spots, and pattern insights from 100+ trades
06 — AI-Powered Coaching
AI Journal Analysis
AI reads your performance data and surfaces patterns. Specific to your trades, not generic advice.
The 80+ automatic strategy tags unlock another layer: AI analysis. The system analyzes hundreds of completed trades across each strategy type and identifies patterns unique to each trader.
It doesn’t generate generic trading tips. It reads actual performance data and surfaces specific insights: “Iron condors in XYZ are 72% profitable vs. 58% overall — this is your strength.” “Your adjustments on downside breaks work 65% of the time — scaling these earlier would protect gains.” “Earnings trades show -2% average ROI — consider avoiding earnings week.”
For educators, this is the 8-AI-powered features promise realized. Students get personalized coaching from data analysis. Partners get the ability to flag high-risk patterns across their entire user base and address them proactively.
- Pattern identification across 100+ trades
- Strengths and blind spots surfaced automatically
- Strategy-specific insights based on your actual P&L data
- Adjustment effectiveness analysis
- Time-based and market-condition performance analysis
- Not generic AI chat — specific to your performance data
07 — B2B Proof Point
Partner Coaching Access
With user permission, partners can view full student journals. See notes, tags, strategy IDs, P&L, adjustments, and life-of-trade.
The journal becomes a collaborative coaching platform. Partners can view any user’s full trade history (with permission), see what strategies they’re trading, review adjustment decisions, track P&L progression, and provide targeted feedback without managing multiple data sources.
This is the feature that transforms iVest+ from a student tool into an educator’s platform. You don’t teach in a vacuum. You coach with full visibility into what your students are actually trading, how they’re managing risk, which strategies they’re executing well, and where they need guidance.
Unlike generic platforms where trade data is locked in a personal account, iVest+ gives educators and coaches the collaborative visibility they need. Your students’ trades are their own, but with permission, coaching becomes informed, specific, and dramatically more effective.
This coaching access capability is the major B2B proof point — this is why educators choose iVest+ and why they build their programs around it.
- View student journals with explicit user permission
- See strategy IDs, tags, life-of-trade progression
- Review P&L at each decision point
- Identify coaching opportunities without manual review
- Track cohort performance across hundreds of students
- Provide targeted feedback based on actual trade data
- Transforms journal into collaborative coaching platform
Coach view showing student trade history, strategy tags, and P&L progression
Cohort rollup — spot outliers, flag coaching opportunities across the whole class
Automated Trade Intelligence Under Your Brand
- ✓ Automatic leg-level trade matching
- ✓ Automatic tagging and tag analysis
- ✓ 80+ strategy identification
- ✓ 25+ performance reports
- ✓ Life-of-trade tracking
- ✓ AI-powered analysis
- ✓ Partner coaching access
All deployed under your branded platform. Your students keep focused on trading. Your coaches get the visibility and insights they need to teach effectively. You get the retention and B2B proof point that builds sustainable business.
Trades imported automatically from Schwab, Tradier, and more. See all supported brokers →