

Charting Module
Where Analysis Meets Action
100+ indicators. Trade lifecycle visualization. Bracket orders with risk-based sizing. Backtesting overlays. AI pattern recognition. All on one chart — and all under your brand. Explore the hotspots to see what’s inside.
Charting Workspace
Interactive Guide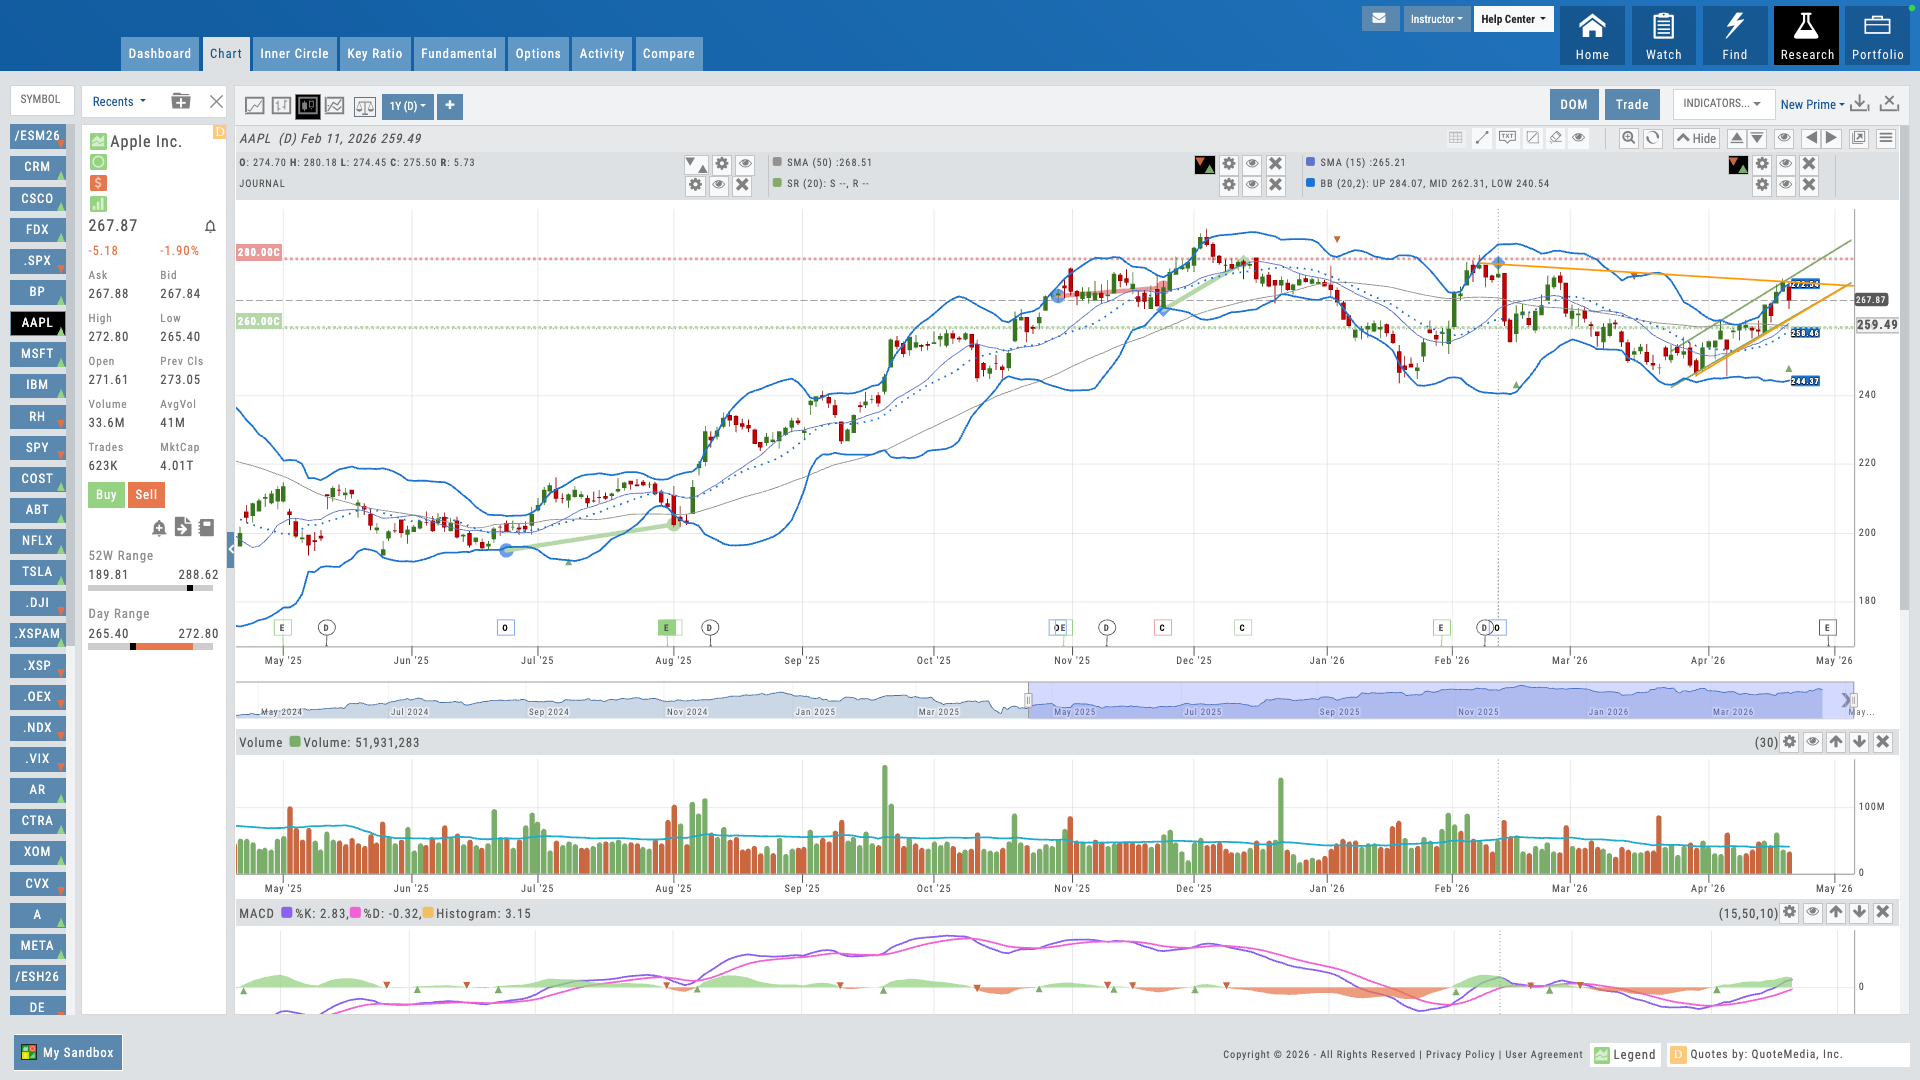
Hover over the pulsing dots to explore features
01 — Core Differentiator
Trade from Chart
Bracket orders, risk-based sizing, and direct trade management — without leaving the chart.
Most platforms separate charting from order entry. iVest+ connects them. Your users can build bracket orders directly on the chart — set entries, stops, and targets visually, then let the platform calculate position size based on their risk parameters. No switching between windows. No mental math. The trade is right where the analysis happens.
For educators, this changes how you teach trade management. Students see the entry, the stop, the target, and the risk — all in one view. It makes abstract concepts concrete and dramatically reduces execution errors.
- Draw your entry, stop, and target right on the chart — by drag, by dollar, or by percentage
- Risk-based quantity sizing — set dollar risk, platform calculates shares
Trade From the Chart
Interactive Guide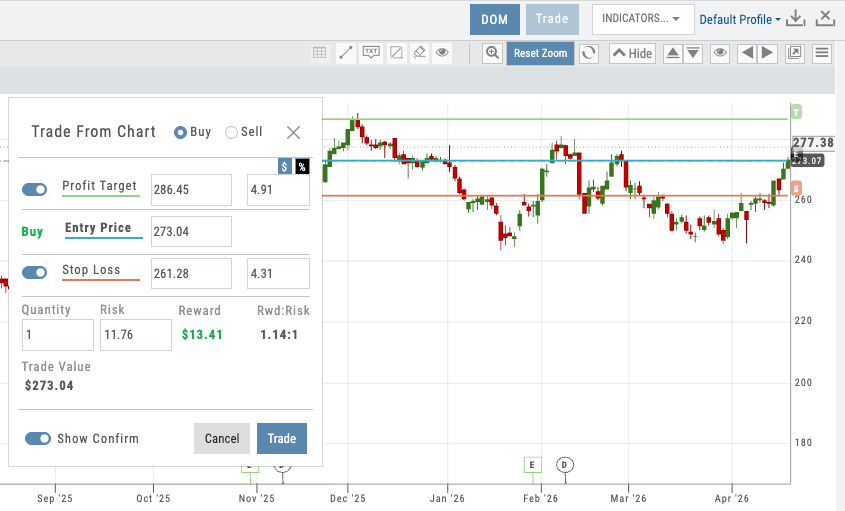
Bracket order on chart with entry/stop/target lines and risk sizing panel
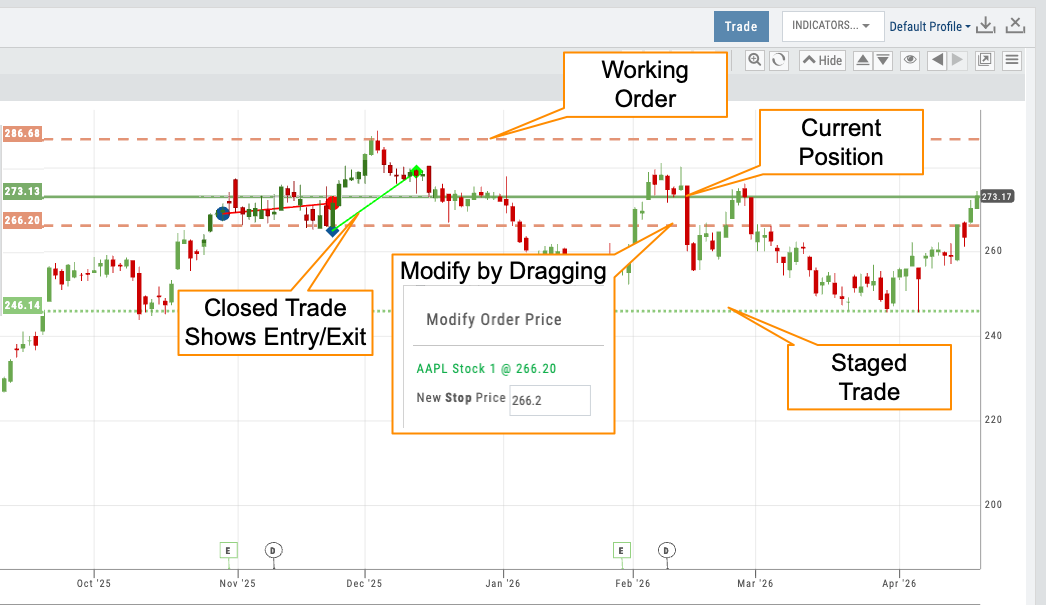
Chart showing all 4 line styles — staged, working, open, closed
02 — Visual Workflow
Trade Lifecycle Visualization
Four distinct line styles show every stage of a trade — from idea to closed position.
Every trade tells a story on the chart. iVest+ uses four different line styles to show where a trade is in its lifecycle: staged trades appear as dotted lines, working orders as dashed lines, open positions as solid lines, and closed trades as historical markers. At a glance, your users know exactly what’s active, what’s pending, and what’s done.
This isn’t just visual polish — it’s a teaching tool. When students can see a trade progress through its stages on the chart, they internalize the workflow: plan, execute, manage, review. No other charting platform visualizes the full trade lifecycle this way.
- Staged — dotted lines for planned but unsubmitted trades
- Working — dashed lines for orders sent to the broker
- Open — solid lines for active positions with P&L
- Closed — historical markers showing completed trades
03 — Analytical Depth
100+ Indicators That Go Far Beyond Price and Volume
Every standard technical indicator, plus beyond-OHLCV data most charting platforms can’t touch — insider scores, institutional ownership, IV/HV, options volume by call/put, and more.
Every standard technical indicator is here — moving averages, RSI, MACD, Bollinger Bands, volume profiles, and dozens more. But iVest+ goes well beyond OHLCV. Chart the insider score to see Form 4 activity trends. Overlay institutional ownership percentage to track smart money accumulation. View historical and implied volatility side by side. Break down options volume and open interest by calls vs. puts. These are the indicators that give traders context most platforms simply don’t offer.
Each indicator is fully customizable — colors, parameters, line styles, and display position. More importantly for partners, you set the defaults. Which indicators appear on a new user’s chart, what parameters they use, what colors they render in — all pushed from the Admin Account. When an instructor says “when the green line crosses up through the red line, it’s a buy signal,” every student is looking at the same green line and the same red line. Teaching stops being a per-student screen-share and becomes a consistent visual language across your user base. The same control extends to system profiles — full indicator collections, pre-configured and owned by the partner.
And iVest+ will develop custom indicators tailored to your specific methodology — available exclusively in your branded platform.
- Technical indicators: MAs, RSI, MACD, Bollinger, Volume, and 90+ more
- Beyond-OHLCV: insider score, institutional ownership %, HV/IV, options volume and OI by call/put
- Full customization — colors, parameters, line styles, positioning
- Partner-set defaults — push your preferred indicators, parameters, and colors to every user from day one
- System profiles — curated indicator stacks controlled by the partner for consistent teaching
- Custom indicator development — built to your methodology, owned by you, exclusive to your platform
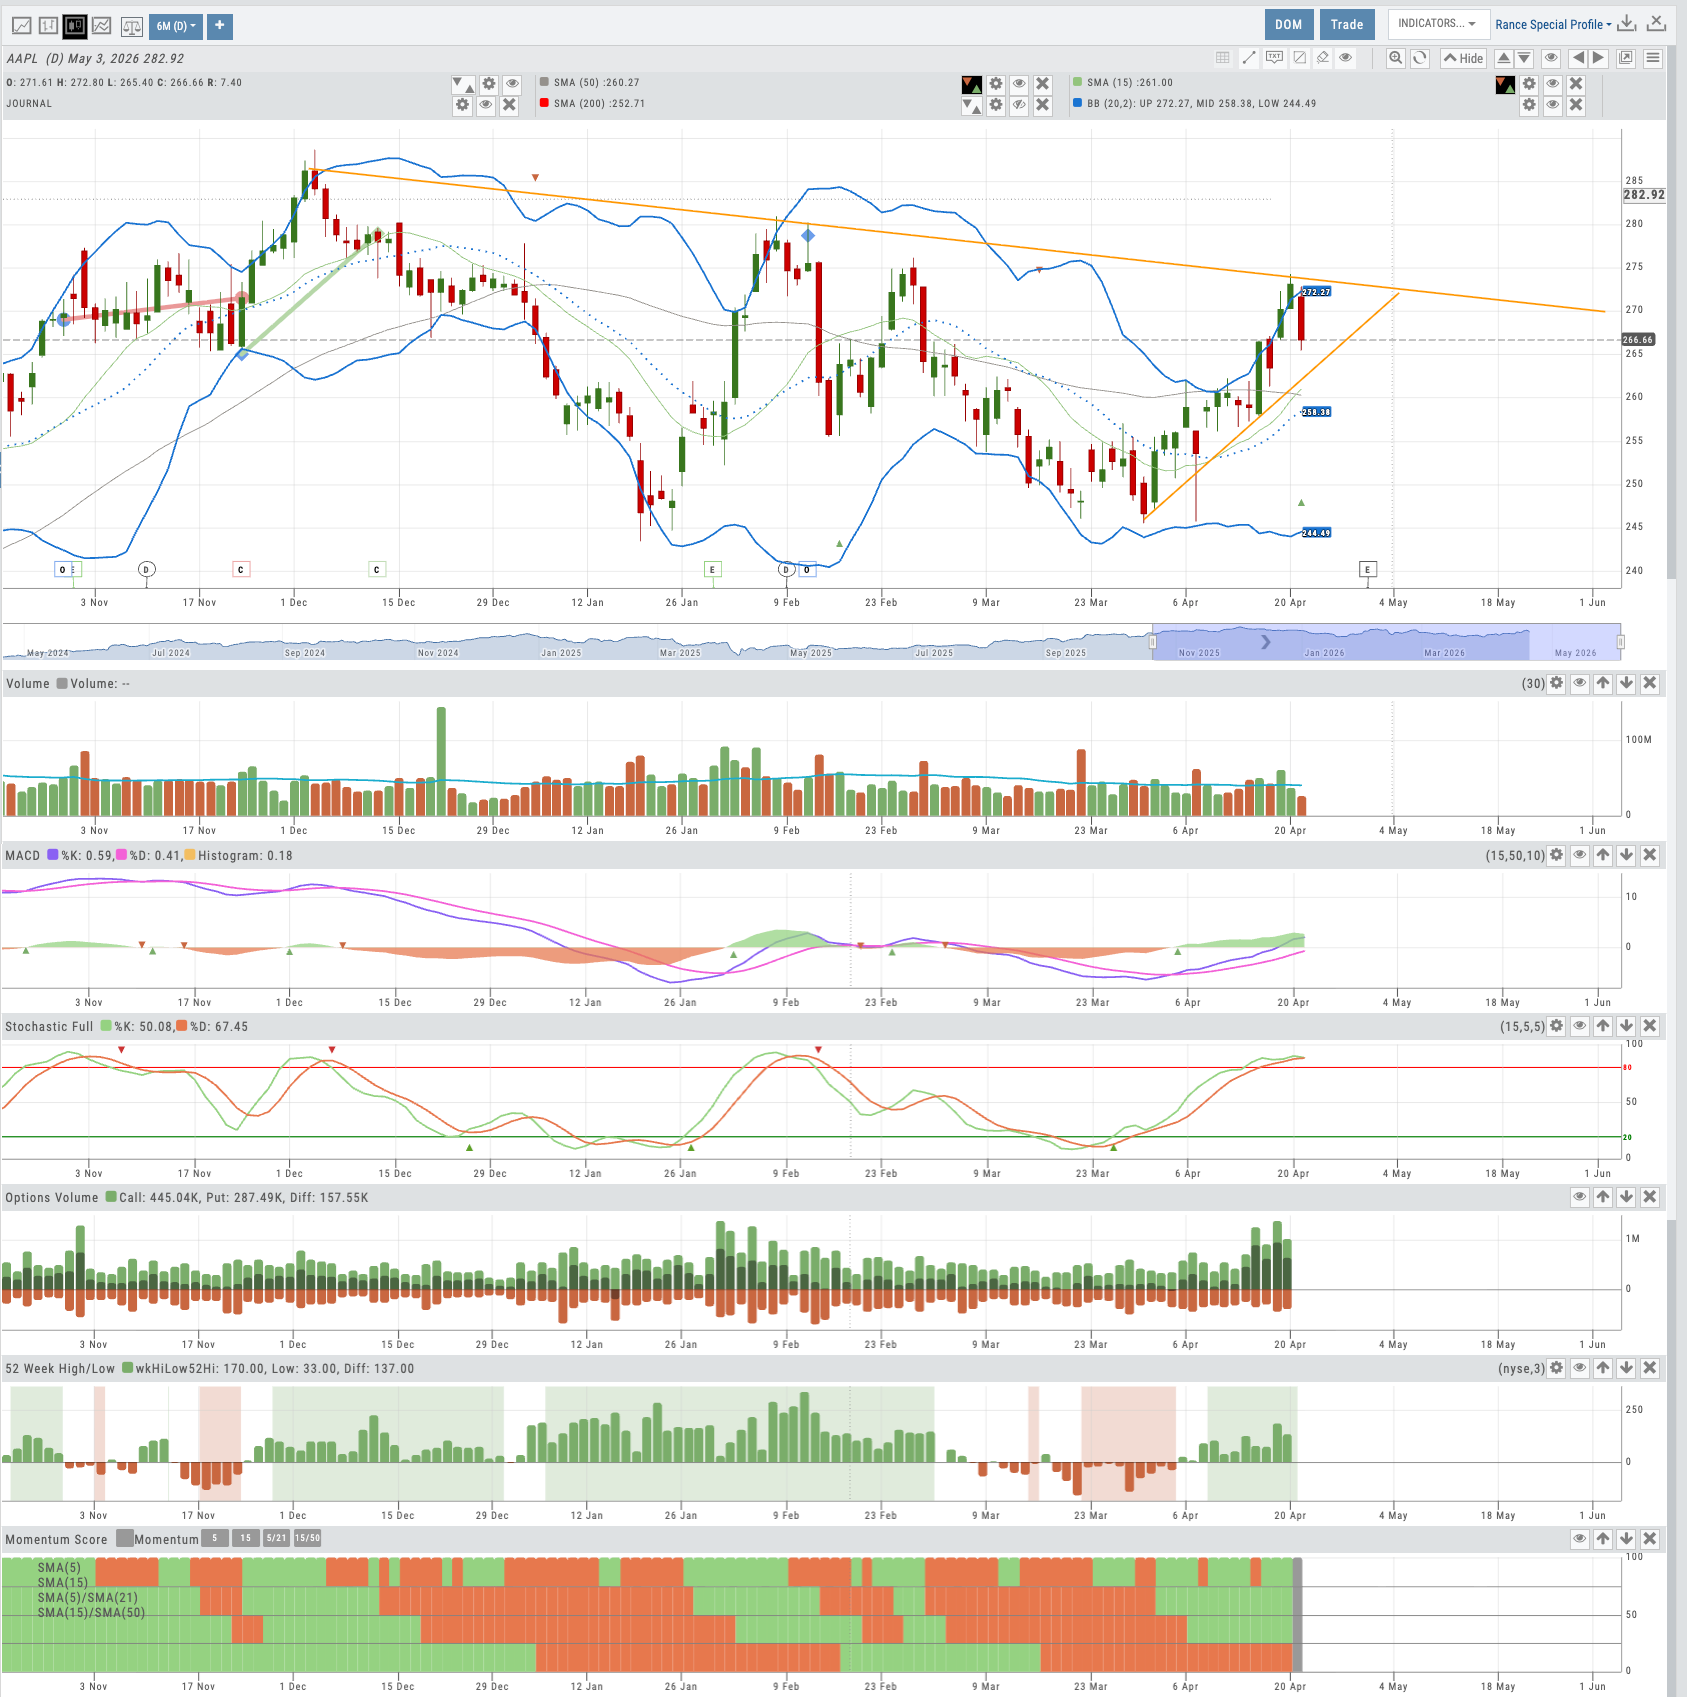
Chart with multiple indicators stacked, including insider score and IV/HV overlays
Partner-set defaults — same indicators, same parameters, same colors for every user from day one
Want to Offer Advanced Charting Under Your Brand?
Trade from Chart, lifecycle visualization, and 100+ indicators — deployed as part of your branded platform.
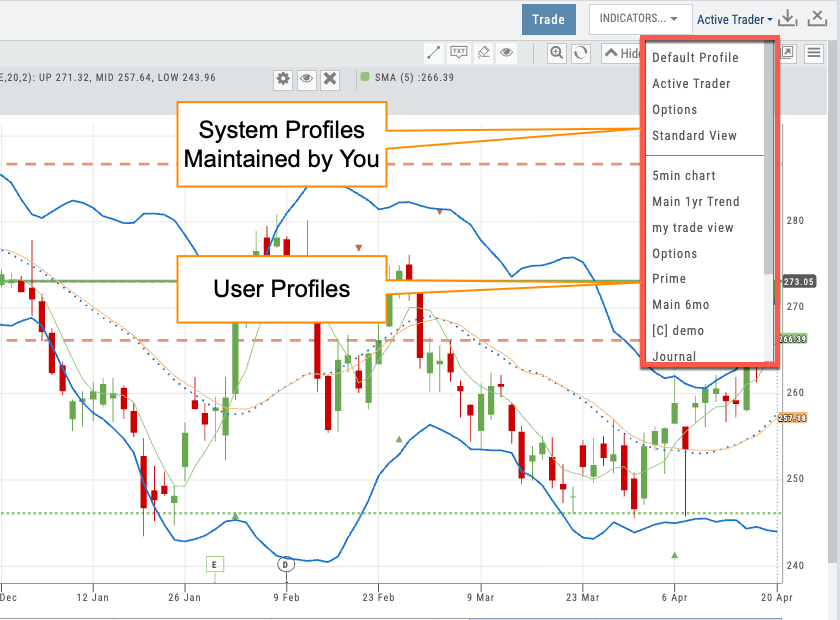
Profile selector showing partner-prefixed defaults and user profiles
04 — Partner Control
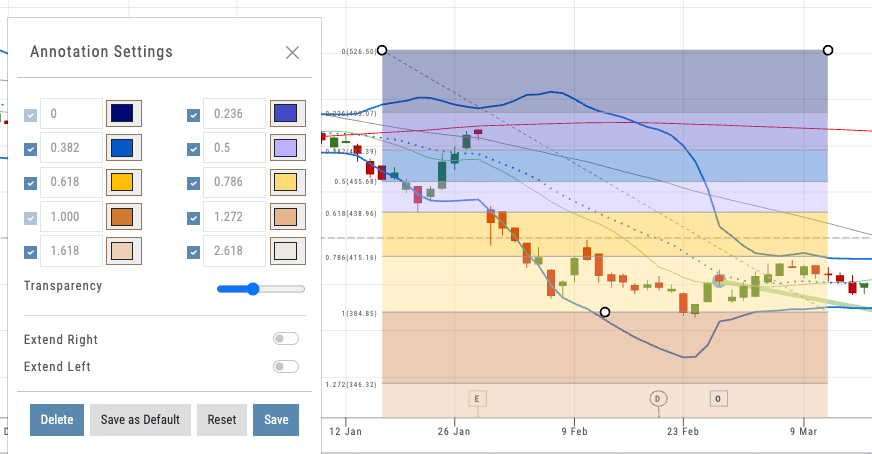
Chart Profiles & Admin Account
Save configurations. Push them to every user. Keep your brand experience consistent from day one.
Chart profiles let users save their preferred indicator setups, timeframes, and display preferences. For individual traders, that means faster workflow. For partners, it’s a control lever: use the Admin Account to push default chart profiles to every user on your platform.
When a new student logs in, they see the chart configuration you’ve chosen — your preferred indicators, your color scheme, your layout. They start with a guided experience instead of a blank canvas. Profiles are prefixed with your partner tag, so your defaults are always distinguishable from user-created ones.
- Save and name unlimited chart profiles
- Admin Account pushes default profiles to all partner users
- Prefix-based organization ([C] tags) for partner vs. user profiles
- Users can customize from your defaults without overwriting them
05 — Full Context
Everything on One Chart
Current trades, past trades, backtesting results, and options legs — all visible in one view.
The iVest+ chart isn’t just a price display — it’s the central workspace. Open positions show with real-time P&L. Prior trades appear as historical reference so users can see what they did last time at this price level. Backtesting results overlay directly on the chart, showing exactly where a strategy would have entered and exited.
Even multi-leg options trades display on the chart, with each leg visible. This level of visual context turns the chart into a decision-making surface: users aren’t just looking at price — they’re looking at their entire trading history and current exposure in one place.
- Active positions with real-time P&L directly on the chart
- Prior trades as historical markers for pattern recognition
- Backtesting results overlaid with entry/exit points
- Options legs visible on the price chart
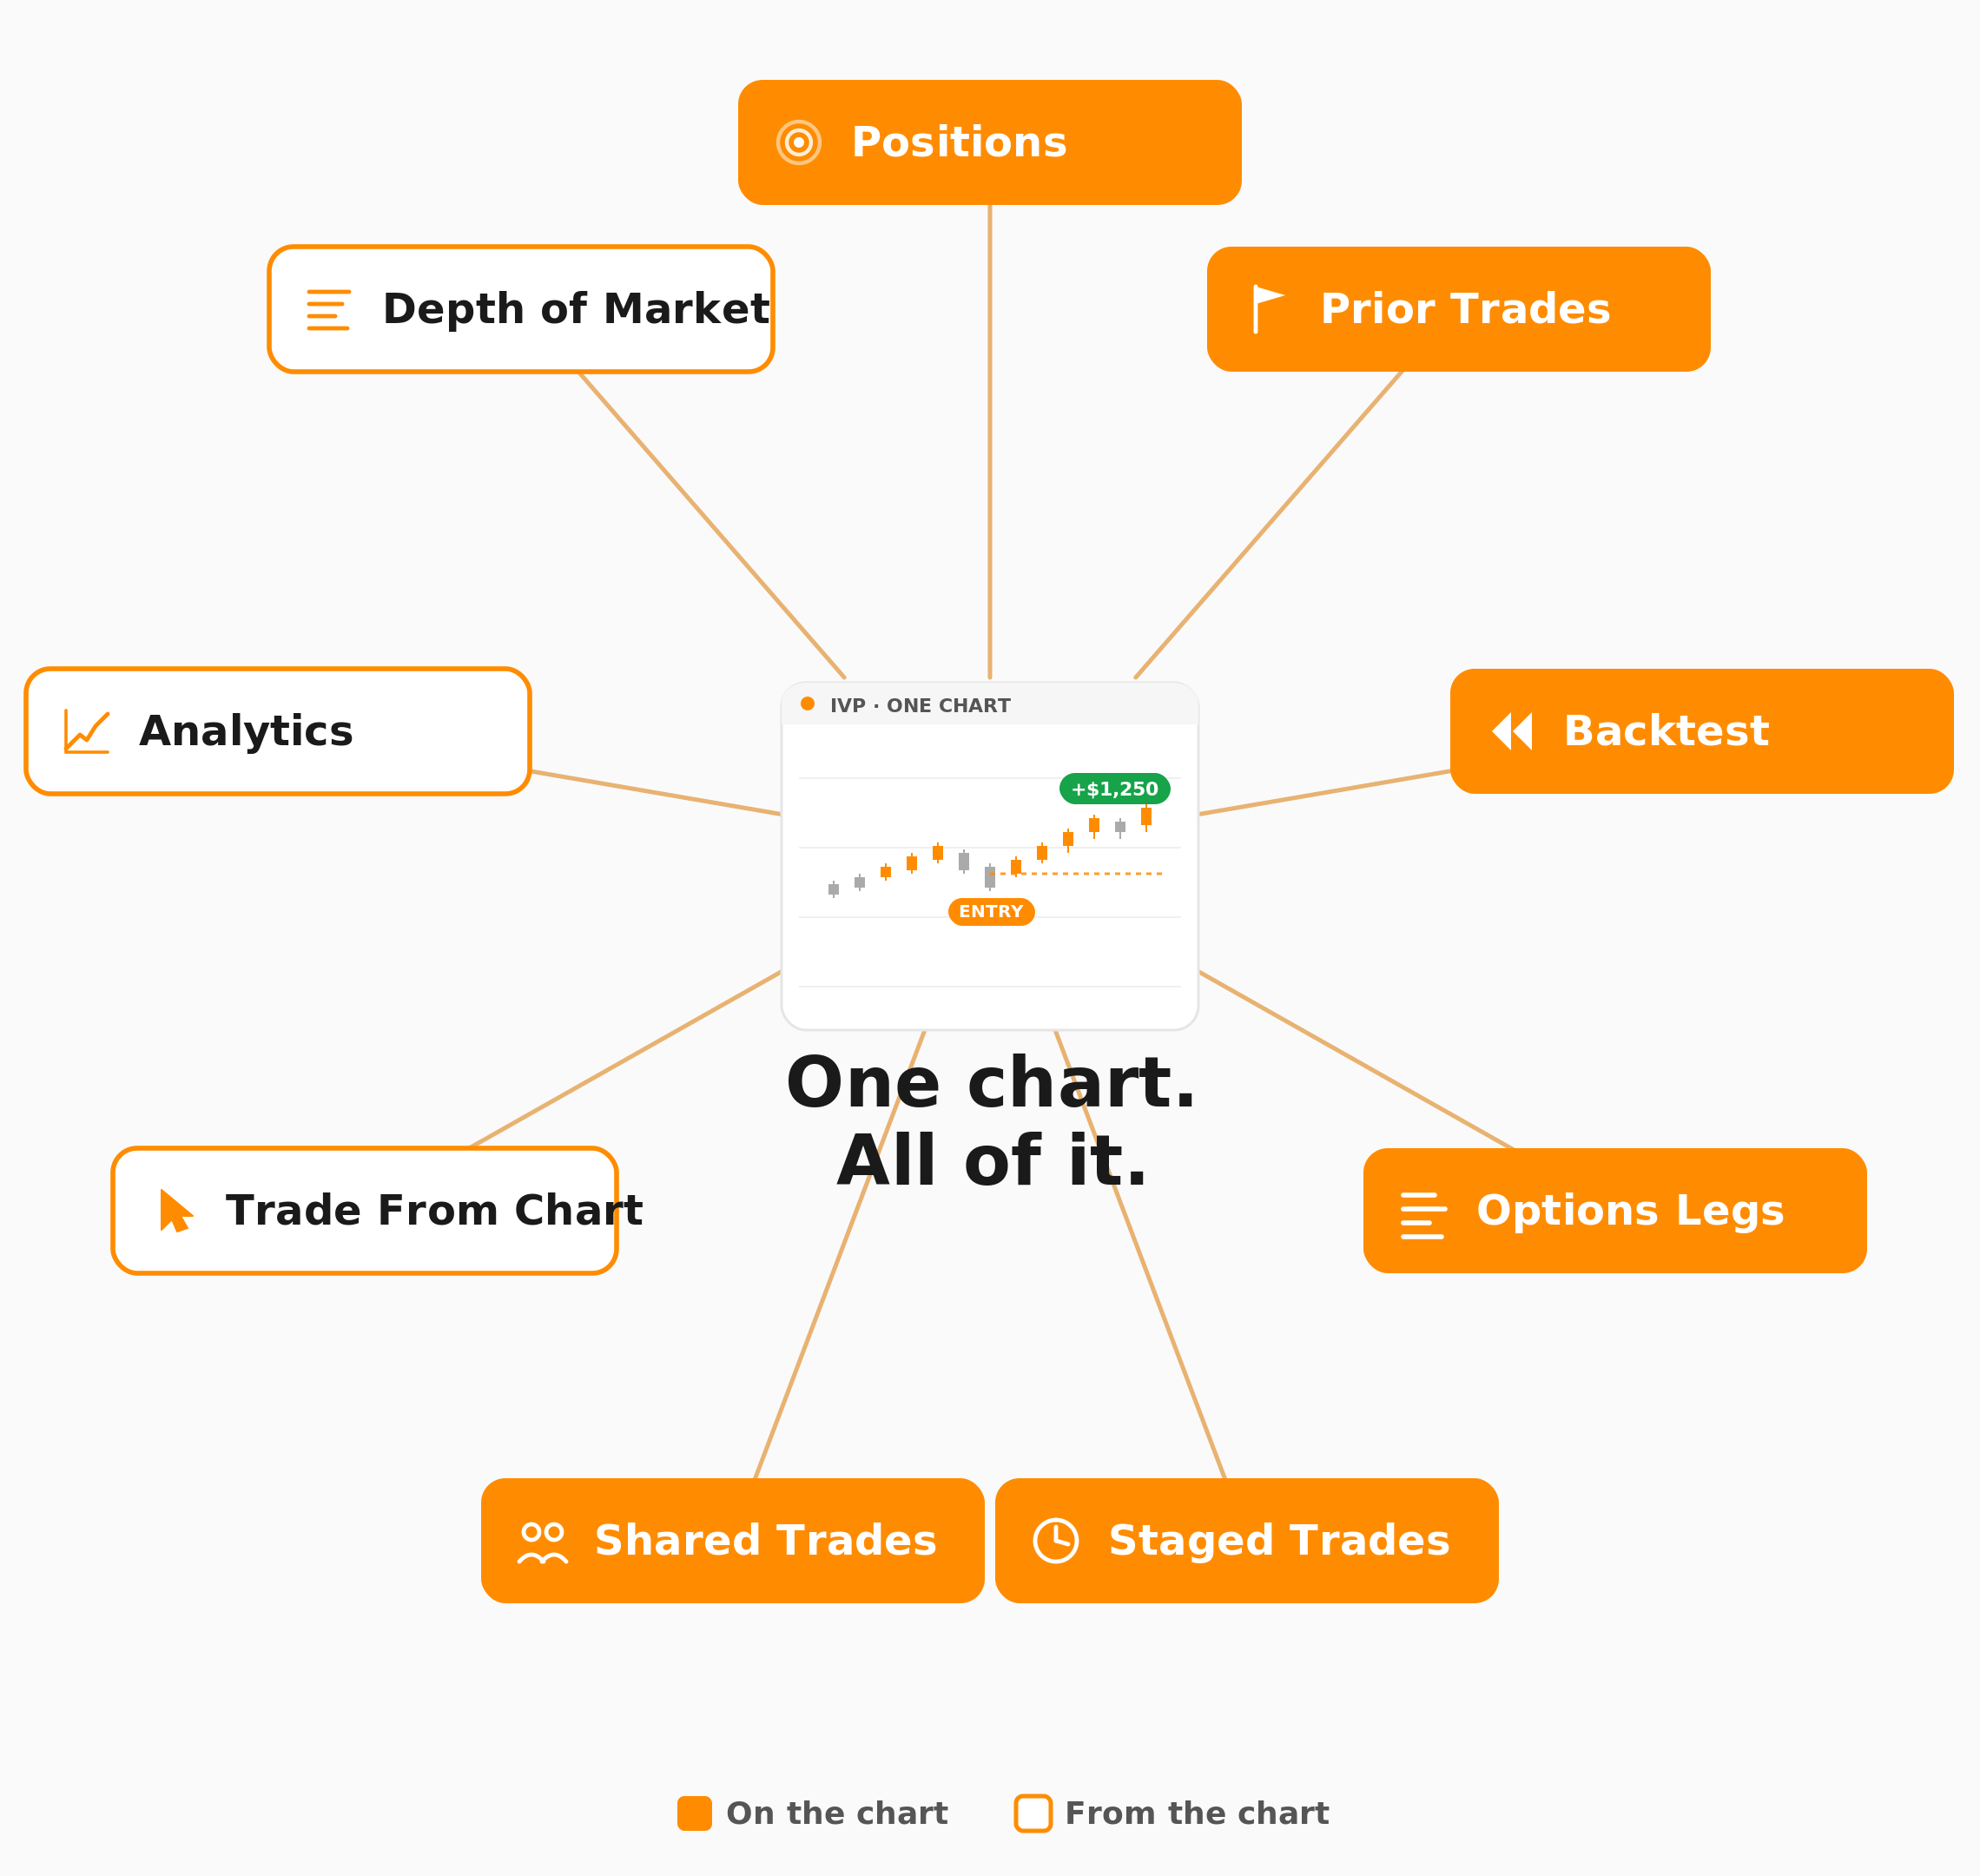
Chart showing active trade, prior trades, and backtest overlay together
Advanced Charting, Under Your Name
Trade from Chart, lifecycle visualization, 100+ indicators, AI technical analysis, and Admin Account control — all deployed as part of your branded trading platform. Your users get institutional-grade charting. You get a retention lever that keeps them coming back.
Connects to leading brokerages including Schwab, Tradier, and more. See all supported brokers →